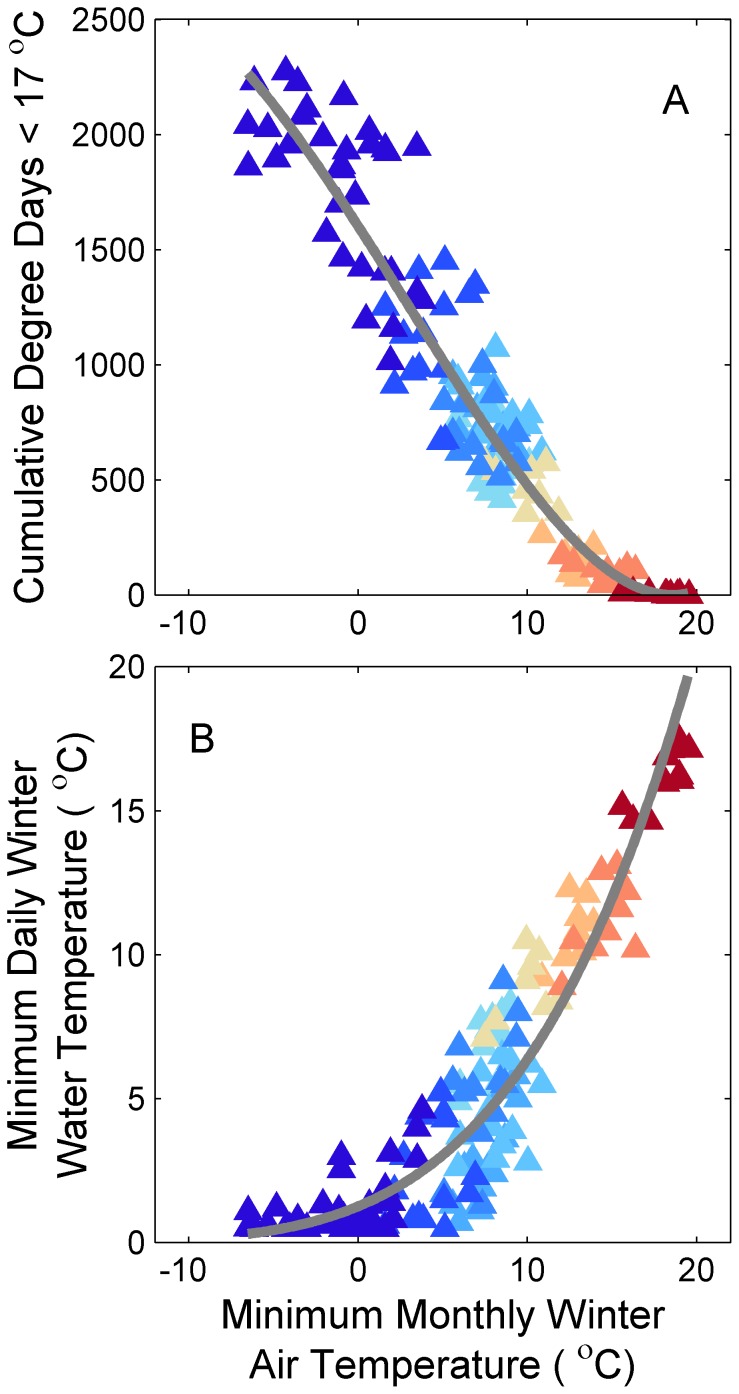
Figure 2. Relations between winter water temperature and air temperature in 12 estuaries along the east coast of the United States.
Points represent winter temperatures in a given year in a given estuary. Estuarine water temperatures are expressed as (A) cumulative degree days <17°C and (B) minimum daily winter temperature (Dec-Mar). Air temperature is expressed as minimum monthly mean winter temperature. Gray line represents the least squares regression fit based on eq. 3. Color of the symbol represents the latitude of the source estuary for the water temperature data (see Figure 1).

