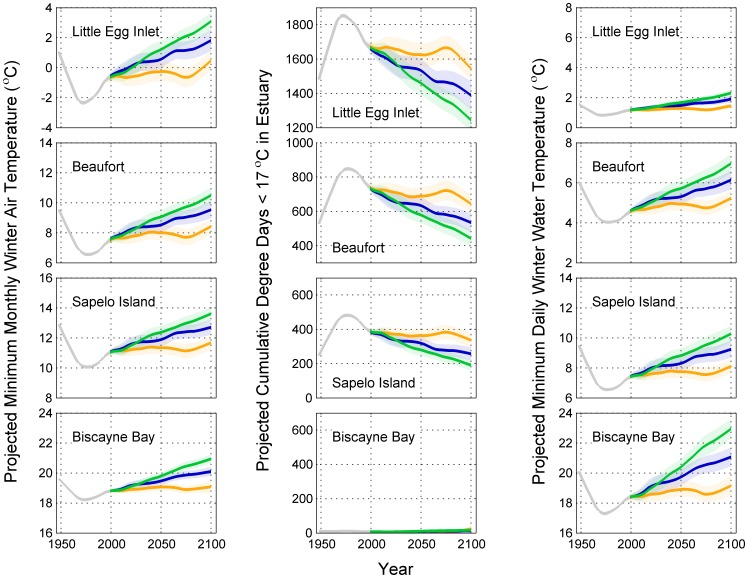
Figure 3. Projections of winter temperature metrics at four estuaries along the east coast of the United States (metrics: minimum mean monthly winter air temperature, cumulative degree days <17°C, and minimum daily estuarine water temperature).
Gray line represents observations, orange line represents projections under the commit scenario (350 ppm CO2 by 2100), blue line represents projections under the B1 scenario (550 ppm CO2 by 2100), and the green line represents projections under the A1B scenario (720 ppm CO2 by 2100). A 40 year LOWESS filter (tension = 0.25) of the mean annual projections from 14 general circulation models is displayed (see Table 1). Shading represents standard error around mean. Observed and projected thermal tolerance metrics were blended over the period 2001 to 2010; the blended value in 2005 is 0.5 * observed +0.5 * projected.

