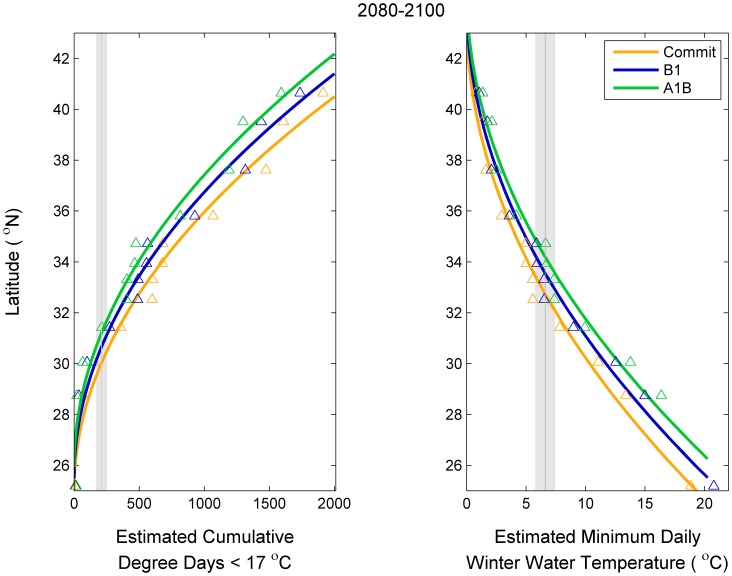
Figure 4. Estimated latitude of thermal tolerance metrics in 2080–2100 under three climate change emission scenarios.
The gray line and shading represent the thermal tolerance metric and 95% confidence intervals for gray snapper juveniles as determined from an experimental study [39].

