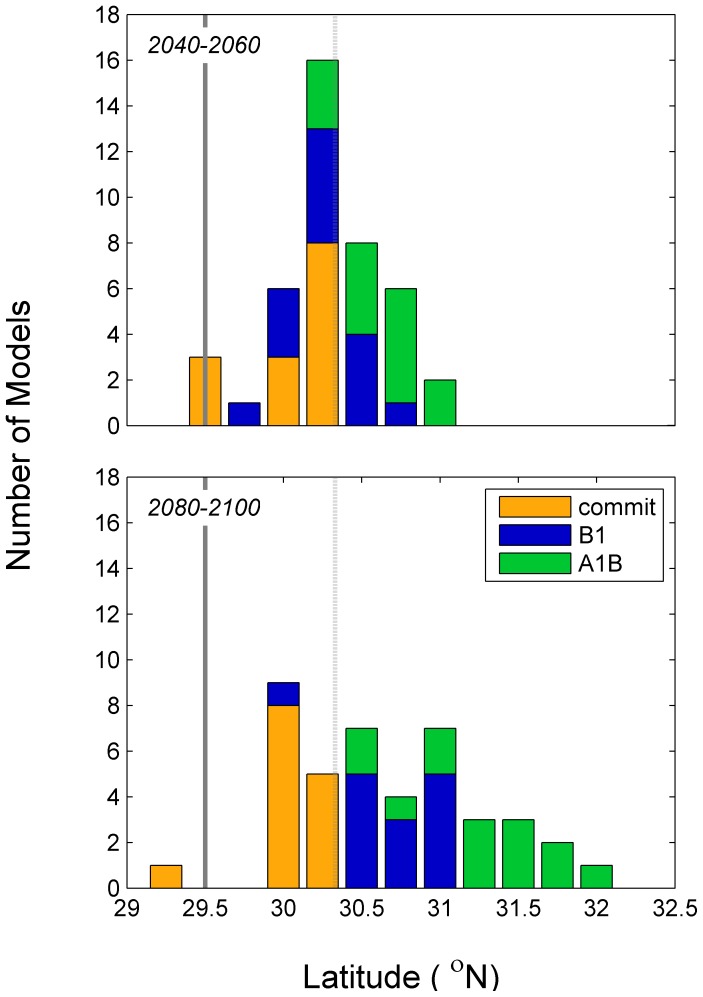
Figure 7. Estimated northern range limit of gray snapper during two time periods and under three emission scenarios.
Results for each of the 14 GCMs are provided to present the range of projections that compose the ensemble. The heavy and light gray lines represent the estimate of current northern range limit and standard error as determined from field observations [39].

