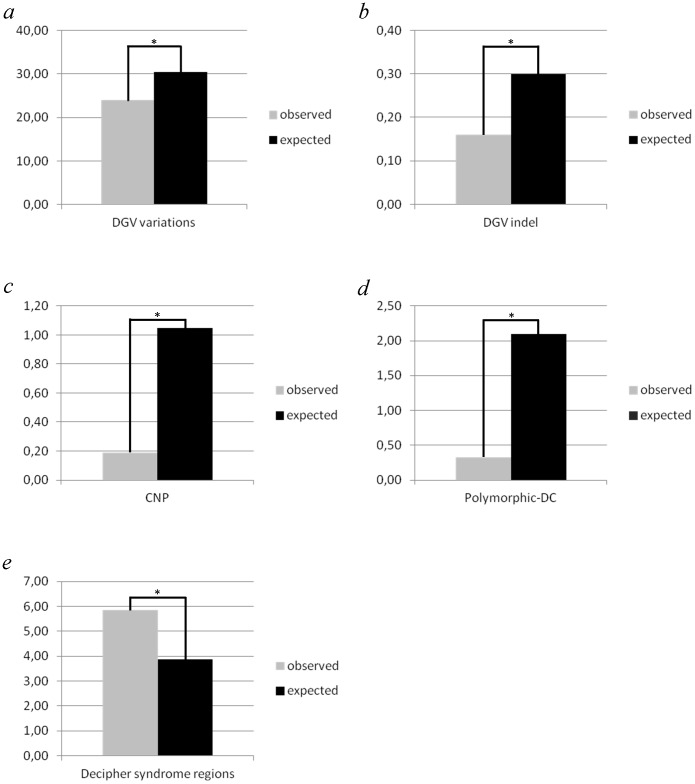
Figure 1. Comparison of observed and expected number (fraction) of VISTA enhancer loci located in different CNV regions.
Bar graphs show the fractions of VISTA enhancer loci (observed numbers, grey bars) and the genome (expected numbers, black bars) covered by “DGV-deposited” CNV regions (a), “DGV-deposited” Indels (b), by two sets of polymorphic CNVs (c and d) and by chromosomal regions implicated in microdeletion/microduplication syndromes (Decipher syndrome regions, (e). All expected values were estimated based on the fraction of the genome covered by CNVs. * p-value = 2.20E−16 as calculated on absolute numbers.

