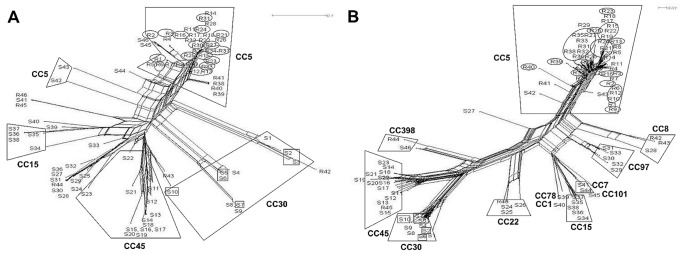
Figure 1. Diversity analysis of all MSSA (S1–S46) and MRSA (R1–R46) isolates by splits graph.
(A) Splits graph constructed based on cost distance matrix produced by Ridom StaphType and (B) on default settings of the IdentiBAC microarray hybridization profiles of 334 genes and alleles. Clonal complexes (CC) as well as the most abundant spa-types t003 (circles) and t012 (quadrates) were highlighted.

