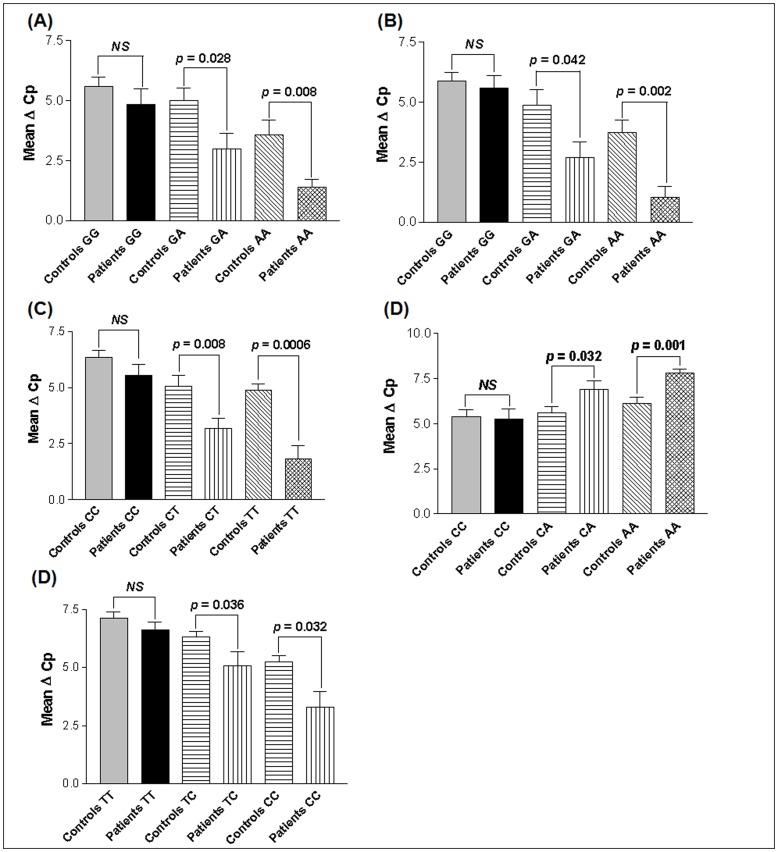
Figure 3. Relative gene expression of TNF-α with respect to promoter genotypes in controls and vitiligo patients.
(A) Expression of TNF-α transcripts with respect to −238 G/A genotypes in 157 vitiligo patients and 174 controls, as suggested by Mean ΔCp. (B) Expression of TNF-α transcripts with respect to −308 G/A genotypes in 157 vitiligo patients and 174 controls, as suggested by Mean ΔCp. (C) Expression of TNF-α transcripts with respect to −857 C/T genotypes in 157 vitiligo patients and 174 controls, as suggested by Mean ΔCp. (D) Expression of TNF-α transcripts with respect to −863 C/A genotypes in 157 vitiligo patients and 174 controls, as suggested by Mean ΔCp. (E) Expression of TNF-α transcripts with respect to −1031 T/C genotypes in 157 vitiligo patients and 174 controls, as suggested by Mean ΔCp.

