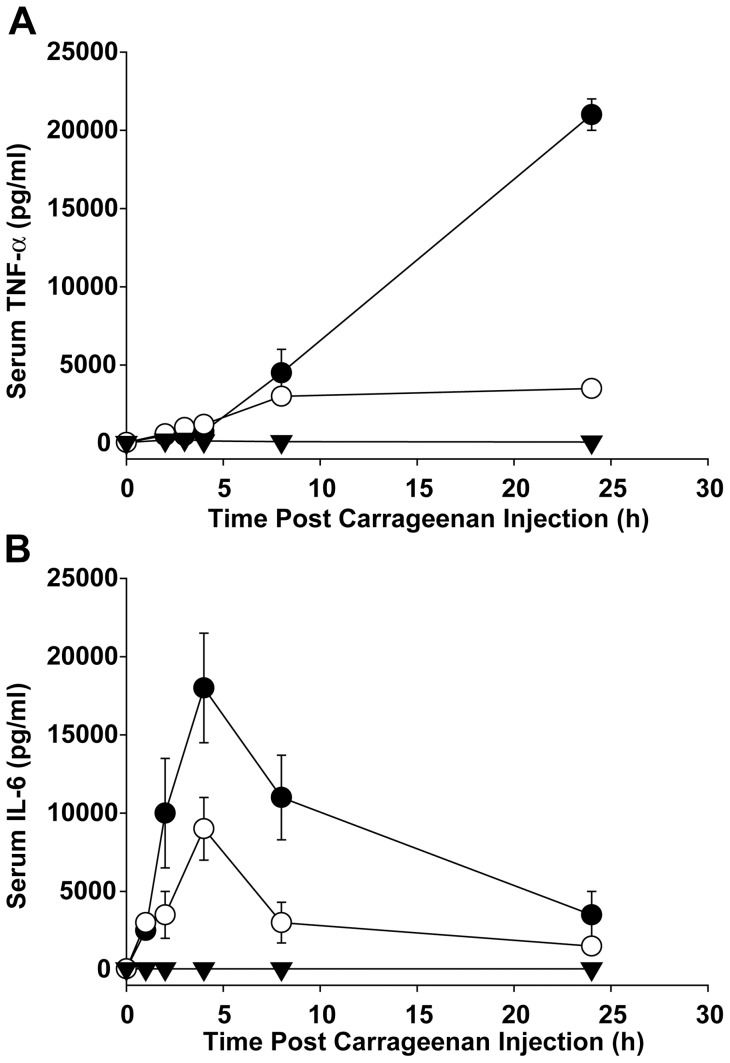
Figure 2. Inhibition of serum TNF-α and IL-6 levels in murine DIC model by MN10021.
Each of 5 groups of 5 CD-1 mice (male, 6–8 weeks of age) were injected i.p. with 0.25 ml of either saline (solid inverted triangles), 1.0 mg (245 nmol) MN20050 in saline (closed circles), or 1.0 mg (245 nmol) MN10021 in saline (open circles). Eighteen hours later the MN20050 and MN10021 groups were injected i.p. with 1.0 ml of 0.45% carrageenan and the saline injected group received an additional 1.0 ml i.p. injection of saline. At each of the indicated times one group for each of the treatment conditions was euthanized, plasma was collected by cardiac puncture into heparinized syringes, and the plasma was stored frozen at −80°C. All samples were assayed for either (A) TNF-α or (B) IL-6 concentration using a solid-phase ELISA per the manufacturer's instructions. The data plotted are the mean values ± SE. Error bars were calculated for all values and if not visible are contained within the symbol.

