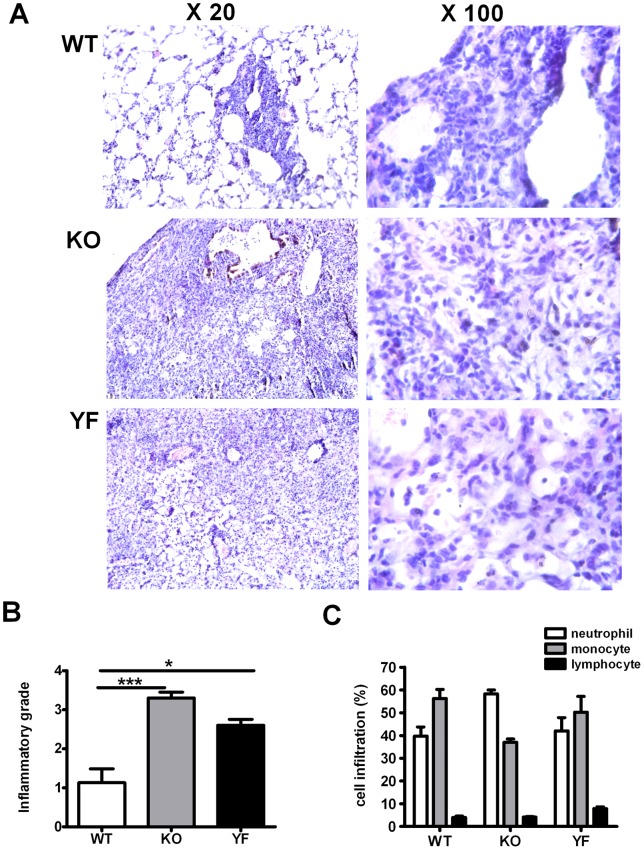
Figure 2. Severity of lung inflammation corresponds to the level of bacterial load.
Lungs were isolated at day 14 post-infection and processed to stain with hematoxylin and eosin as described in Materials and Methods. A Representative images of the lung tissues were shown at low (20X) and high (100X) magnification. B and C Semi-quantitative analysis of lung inflammation. Slides were examined by a blinded pathologist and the inflammatory grades (B) and the composition of immune cell infiltrates (C) were analyzed as described in Materials and Methods. Data represent mean ± SD of 4 slides from 4 mice per group. * p<0.05, *** p<0.001.

