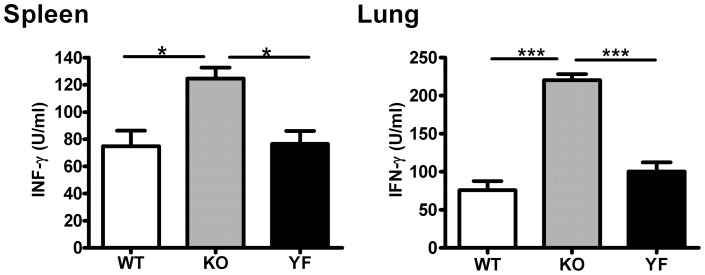
Figure 5. ICOS-KO cells but not ICOS-YF cells show an elevated IFN-γ production compared to WT cells upon restimulation.
Single cell suspensions of splenocytes or lung mononuclear cells were prepared at day 14 post-infection and were restimulated in vitro as described in Materials and Methods. The amounts of IFN-γ in culture supernatants were measured by ELISA. Data are presented as mean ± SD (7 ICOS-WT, 4 ICOS-KO, and 7 ICOS-YF mice) from one representative experiment out of three independent experiments with consistent results. * p<0.05, *** p<0.001.

