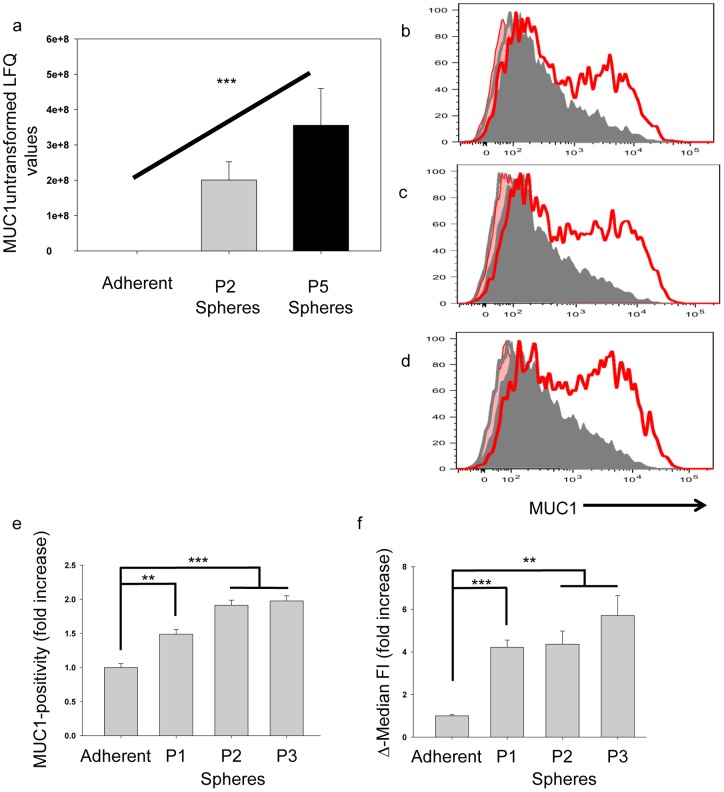
Figure 2. MUC1 expression on MCF-7 grown in matched adherent and sphere-promoting conditions.
(a) Proteomics results (y-axis is untransformed label free quantitation (LFQ) values) indicate that the intensity of MUC1 expression is greater on sphere-cultured passage (P) 2 and P5 MCF-7 cells compared to adherent cells (line over columns), ANOVA test, *** p<0.001. (b–d) Surface expression of MUC1 was analyzed by flow cytometry on MCF-7 cells grown as matched adherent (shaded-grey) and sphere (red-line) cultures. The red shaded areas and grey lines represent the isotype controls for sphere and adherent cultures respectively. Sphere cultures were analyzed after 1 (b), 2 (c) and 3 (d) 6-day passages. Live-gated cells were analyzed for the frequency of MUC1-positivity (e) and Δ-median fluorescence intensity (FI) (f). Fold increase values for sphere cultures above the corresponding adherent culture are shown in bars representing the average and SEM of 3 biological repeats. Each biological repeat is the average of three technical repeats. Statistical significance of the change in MUC1 expression for each passage of spheres was calculated compared to adherent cells using a Student's t-test (*** p<0.001; ** p<0.01). Error bars represent SEM.

