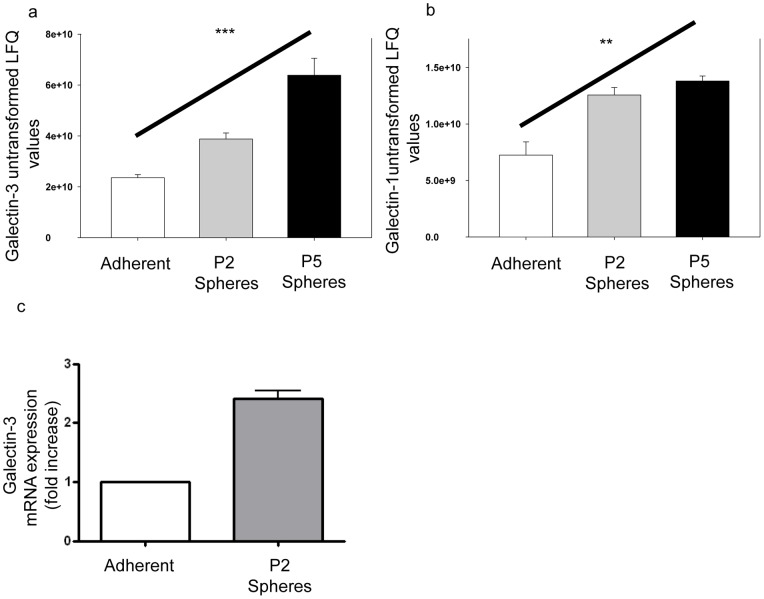
Figure 3. Galectin-3 expression on MCF-7 adherent cells and tumourspheres.
Galectin-3 (a) and Galectin-1 (b) proteomics results (y-axis is untransformed label free quantitation (LFQ) values) indicate increased expression within spheres compared to adherent cells, (line over columns), ANOVA test, *** p<0.001; ** p<0.01. (c) Comparative quantitation of mRNA expression of Galectin-3 for adherent and P2 spheres. P2 spheres and adherent cells were analysed for expression of galectin-3 by quantitative RT-PCR. Results are displayed as fold increase relative to adherent cells and normalized to β-actin. Error bars represent SEM.

