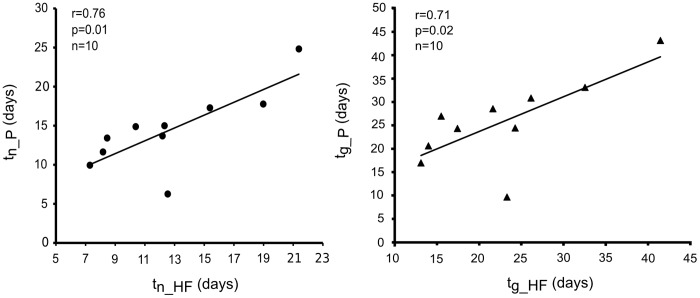
Figure 3. Correlation between recovery time for performance (tn_P) and HF power (tn_HF) and between peak time for performance (tg_P) and HF power (tg_HF).
Significant correlation was demonstrated first, between the time to recover to the initial level of performance (tn_P) and HF power (left panel) and second, between the time to peak performance and HF power (tg_HF).

