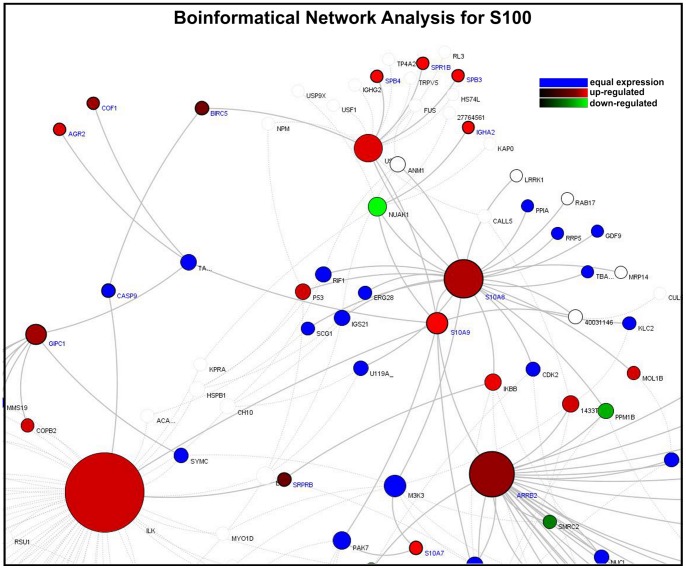
Figure 7. Bioinformatical network analysis for S100.
Proteins are the nodes and the edges are protein activation/inactivations, such as phosphorylation and dephosphorylation across a set of proteins. The S100 Network shows an up-regulation of S100A7, S100A8 and S100A9 as well as ILK and IκB, USF2 and ARRB2. In which NUAK1 seems to be down-regulated. Different colors showing the expression of genes with the cholesteatoma compared to external auditory skin: red: up-regulated; green: down-regulated; grey: the gene for the protein is not in the microarray; Node-Size also called “Node Ranking” describes the number of interactions. The bigger the nodes, the more interactions are represented for the protein in the network.

