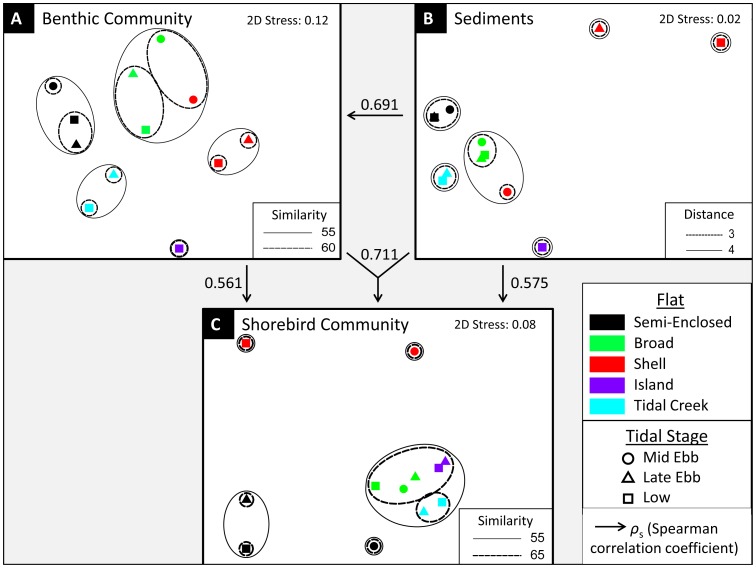
Figure 4. N-MDS ordinations displaying similarities/differences among shorebird and benthic community compositions and sediment grain-size distributions.
Results of (A) benthic community composition, (B) sediment grain-size distribution, and (C) shorebird community composition n-MDS ordinations, comparing each combination of flat and tidal stage, with overlays of circles and ovals grouping flats according to cluster analysis results. Similarities given in percent. Grain-size cluster analysis overlay (B) is based on dissimilarity; increasing “Distance” values indicate an increase in dissimilarity among samples. Stress value of 0.12 (A) indicates that the 2-dimensional n-MDS ordination is an adequate and useful representation of sample relationships; stress value of 0.02 (B) indicates that the 2-dimensional n-MDS ordination provides an excellent representation of sample relationships; stress value of 0.08 (C) indicates a good representation. In (B), symbols for Semi-Enclosed Flat at late ebb and low tides are superimposed. In (C), Shell Flat at late ebb tide is not depicted because birds were never observed on the flat at that tidal stage.

