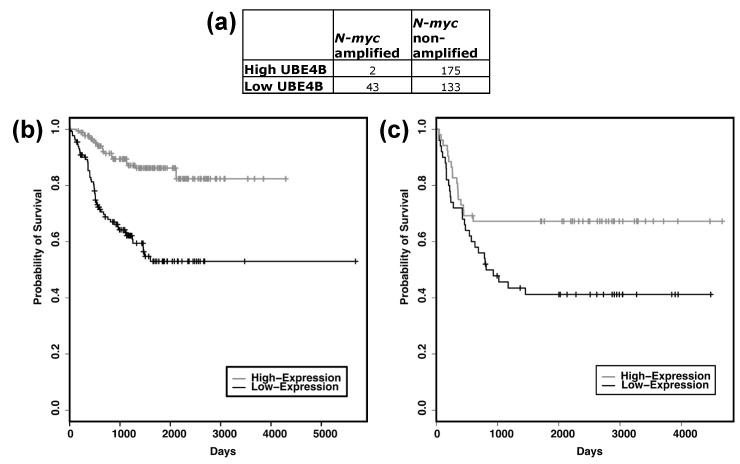
Figure 2. Outcomes of neuroblastoma patients with non-amplified N-myc based on UBE4B expression.
The NCI Oncogenomics gene expression databases were evaluated for outcomes of neuroblastoma patients and Kaplan-Meier survival curves were generated. (A) Numbers of patients with high or low UBE4B gene expression compared to presence or absence of N-myc gene amplification (Fisher-exact test, p=2.87e-14). (B) Estimated overall survival for neuroblastoma patients with N-myc non-amplified tumors having high UBE4B gene expression (grey, n=175) and low UBE4B gene expression (black, n=133) (log-rank test, p=9.0e-9). (C) Estimated overall survival for neuroblastoma patients from the Neuroblastoma Prognosis Database-Seeger Lab dataset with tumors having high UBE4B gene expression (grey, n=52) and low UBE4B gene expression (black, n=50) (log-rank test, p=0.021).

