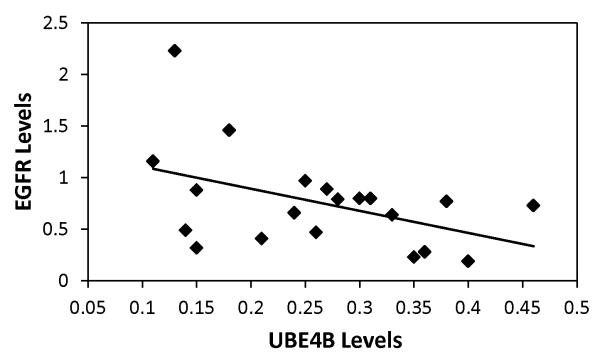
Figure 4. UBE4B and EGFR expression levels in tumors.
Human neuroblastoma tumor samples were obtained from the Children’s Oncology Group (COG). Tumor sample lysates were separated on SDS-PAGE gels. Immunoblots for UBE4B and EGFR were performed and relative protein levels were determined. A Spearman’s correlation was performed with UBE4B and EGFR protein levels as shown (Rho = −0.4545; p<0.05).

