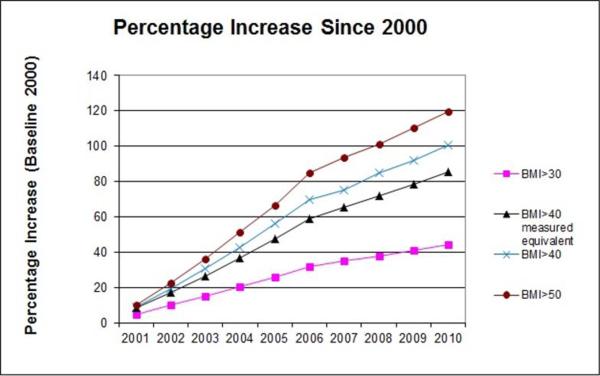
Figure 1. Prevalence growth by severity of obesity (in percent over 1986 baseline).
Notes: Author's calculation based on Behavioral Risk Factor Surveillance Survey, BMI cutpoints calculated based on self-reported height and weight. Adjusted line (squares) uses cutpoint of 37.3 for men and 37.0 for women to make it comparable to BMI>40 calculated from objective height and weight measurement. 200 indicates a 200% increase over baseline, i.e. a tripling of baseline rates.

