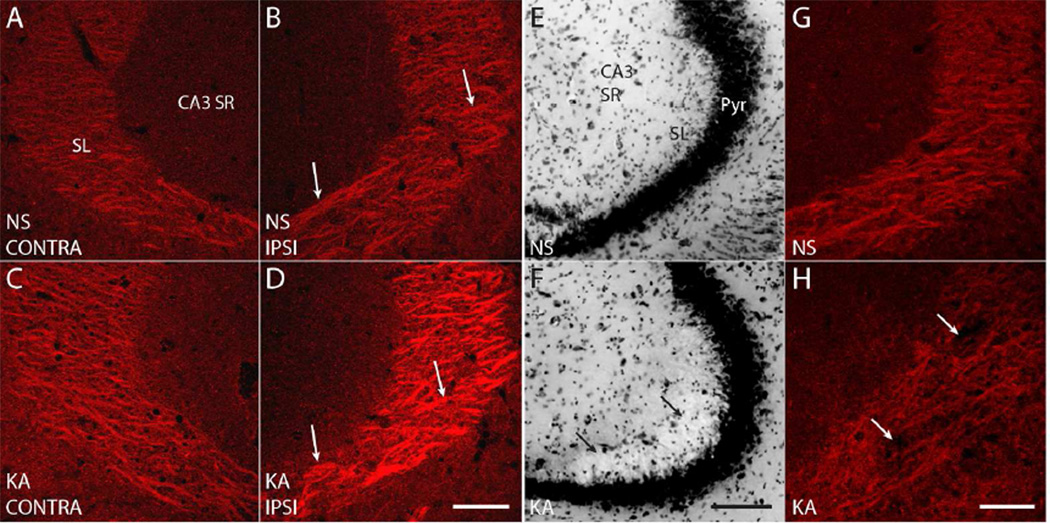
Figure 2. High magnification (630×) images reveal discrete patches of pY816 immunoreactivity within SL, enhanced preferentially on the side ipsilateral to KA microinfusion.
A–D) Representative high magnification (630×) images of SL from CA3b in NS (A, B; top) and KA (C, D; bottom) treated mice, both ipsilateral (B, D; IPSI, right) and contralateral (A, C; CONTRA, left) to microinfusion. Arrows point to discrete patches of pY816 immunoreactivity that could be discerned within SL, and a noticeable increase in intensity of these immunoreactive areas can be seen in the KA treated animal ipsilateral to infusion compared to NS (B, D). Scale bar = 50 µm. E, F) Nissl stain of the CA3 region from a KA treated mouse (F) showing disruption of SL cytoarchitecture (arrows). The SL damage observed is representative of that found in two animals discarded from analysis due to this issue. Note the normal appearing SL in the NS treated littermate (E). Pyr is CA3 pyramidal cell layer. Scale bar = 100 µm. G, H) pY816 staining from the same hippocampi as in (E, F) demonstrates a relative paucity of stain in the KA treated animal (H; arrows) within SL compared to its NS infused littermate (G). Scale bar = 50 µm.

