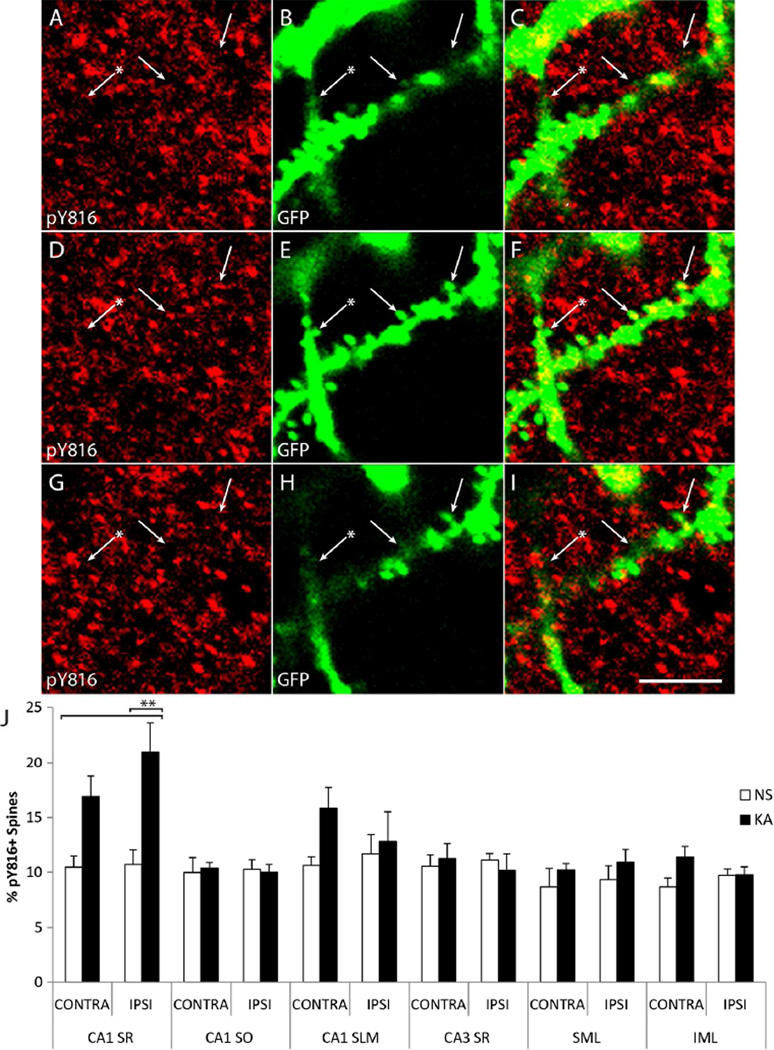
Figure 9. pY816 TrkB immunoreactivity is enhanced within dendritic spines in CA1 SR following KA-SE, observed preferentially in the hippocampus ipsilateral to infusion.
A–I) Confocal micrographs from CA1 SR from a Thy1-GFP mouse treated with KA. Three z-sections are shown taken at 750 nm increments above (A–C; top), within (D–F; middle), and below (G–I; bottom) two GFP+ spines (E; arrows) of an apical dendrite that contain small pY816 puncta (D; arrows). Other spines (E; arrow with asterisk) do not appear to contain pY816 (D; arrow with asterisk). Note colocalization of pY816 with spines in the z-plane (observe panels from top to bottom and note arrows), such that these pY816 puncta are observable within the spine but not above or below it. Merged pY816 and GFP images are shown in (C, F, I). Scale bar = 2.5 µm. J) Quantification of percentages of GFP+ spines found to contain pY816 immunoreactivity in Thy1 GFP-expressing mice in CA1 SR, CA1 SO, CA1 SLM, CA3 SR, the outer twothirds of SML, and the outer two-thirds of IML. This was quantified under both NS (n=5) and KA (n=5) conditions, both ipsilateral (IPSI) and contralateral (CONTRA) to the side of infusion. In spines of CA1 SR ipsilateral to KA infusion, a 2.0-fold increase in the numbers of pY816+ spines was observed compared to NS treated animals (p<0.01, one-way ANOVA; p<0.01, post-hoc Bonferroni’s test). The contralateral side demonstrated a more modest, 1.6-fold increase which was not significant. Data is from 994 spines analyzed under NS conditions, 1020 spines analyzed under KA conditions. No significant differences in the numbers of pY816+ spines were found in any of the other regions analyzed (CA1 SO p=0.993, 2097 spines; CA1 SLM p=0.272, 2428 spines; CA3 SR p=0.899, 2263 spines; SML p=0.604, 1940 spines; IML p=0.128, 1958 spines, one-way ANOVA). Quantification is presented as mean % of neuronal processes ± SEM; all data analyzed by one-way ANOVA and post-hoc Bonferroni’s test; **p<0.01.

