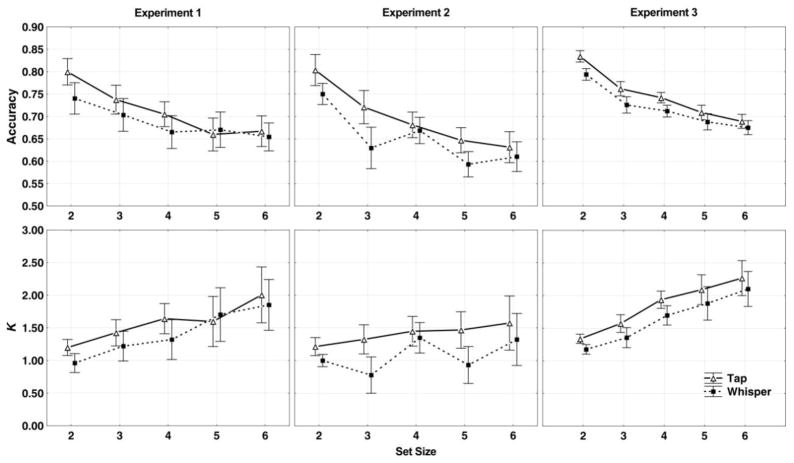
Figure 2.
Results for Presentation Method 1, in which a list of 6 tones was presented and an arrow cue indicated the first tone that was to be remembered. Top panels, accuracy rates; bottom panels, k value estimates. Left-hand panels, results for Experiment 1; middle panels, Experiment 2; and right-hand panels, Experiment 3. The k values are calculated with Cowan’s k formula (Cowan, 2011). The solid lines with open triangles denote the “tap” trials, and the dashed lines with solid squares denote the “whisper” trials. The error bars represents 95% repeated-measure confidence intervals (Hollands & Jarmasz, 2010).

