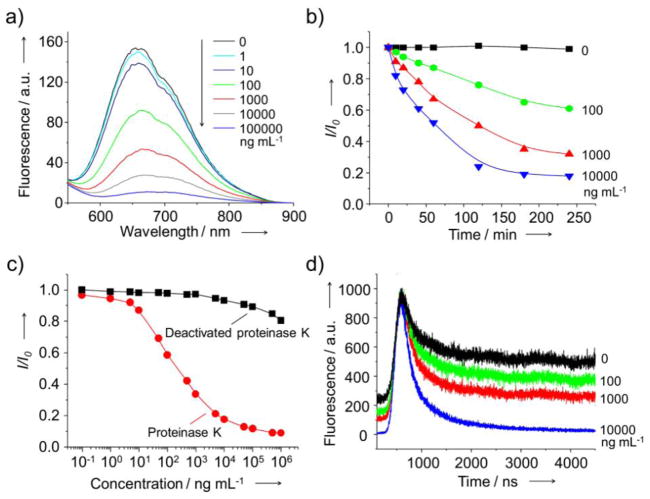
Figure 2.
(a) Fluorescence spectra taken from aqueous suspensions of BSA-AuCs after incubation with proteinase K at different concentrations for 4 h. (b) Plots of I/I0 as a function of incubation time after the introduction of proteinase K at different concentrations. (c) Plots of I/I0 as a function of the concentration of proteinase K or deactivated proteinase K, which went through heating at 95 °C for 20 min. Here I0 and I represent intensities of fluorescence from BSA-AuCs in the absence and presence of proteinase K, respectively. (d) Fluorescence decay curves for BSA-AuCs after incubation with proteinase K at different concentrations. Aqueous suspensions of BSA-AuCs were excited at 500 nm.

