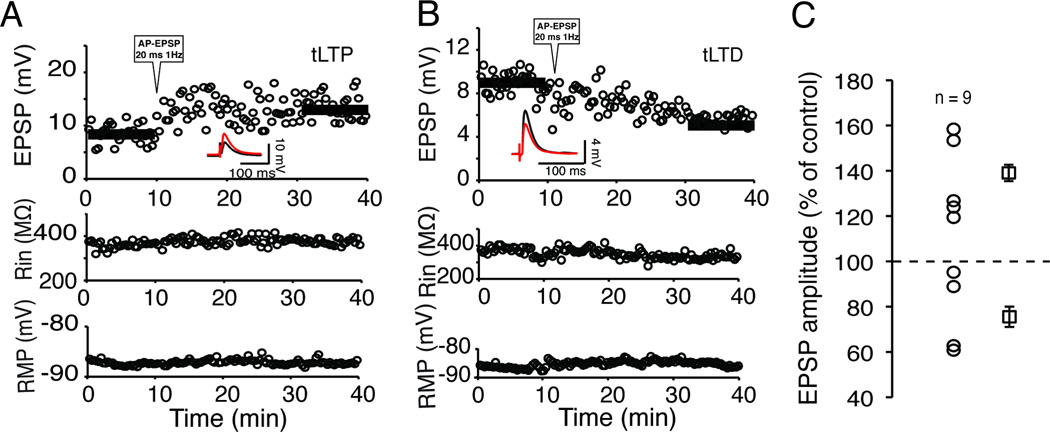
Figure 2. GABAA receptor antagonist does not affect STDP.
A graph of EPSP amplitude, from a MSN, monitored very 20 sec for 40 min, showing tLTP in presence of 15 µM bicuculline. The pairing protocol (AP-EPSP, 20 ms 1 Hz) was applied following a 10 min control period. Solid horizontal bars indicate average EPSP amplitudes before and after the first pairings. Two lower panels show input resistance (Rin) and RMP over the same recording period. B Same graph as in A form another MSN showing tLTD. C Averaged EPSP amplitudes expressed as percent of control in presence of bicuculline. Each symbol represents a MSN. Symbols on the right with S.E.M show averaged tLTP and tLTD amplitude.

