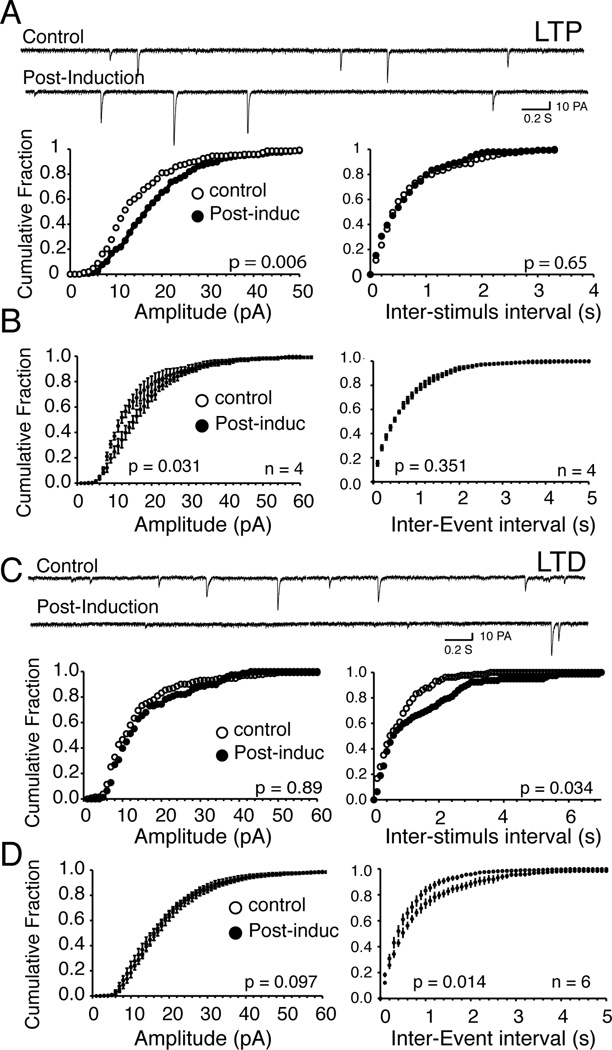
Figure 6. tLTD but not tLTP is associated with a decrease of glutamate release.
A Traces of sEPSCs measured at resting membrane potentials (−91 mV) from a representative NAcc MSN before (control) and 15 min after (post-induction) tTLP induction. Each downward deflection represents one sEPSC. Lower panels show cumulative fraction amplitude (left panel) and frequency histograms (right panel) of same neuron. B Averaged cumulative fraction histograms of spontaneous EPSCs amplitude (left panel) and frequency (right panel) in tLTP MSNs (n = 4). While inter-event interval shifts to the right (i.e. lower frequency) after induction in tLTD MSNs only, there is not change of amplitude. C Traces of sEPSCs measured at resting membrane potentials (−88 mV) from another representative NAcc MSN before (control) and 15 min after (post-induction) tTLD induction. Lower panels show cumulative fraction histogram of amplitude (left panel) and frequency (right panel) of same neuron. D Averaged cumulative fraction histograms of sEPSCs amplitude (left panel) and frequency (right panel) in tLTD MSNs (n = 6). Statistical comparison before and after induction is shown in lower right corner of each histogram.

