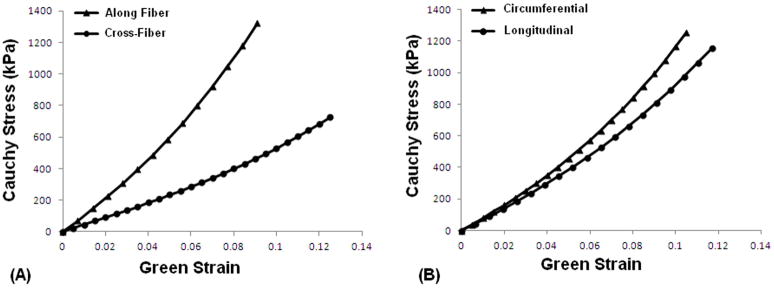
Figure 6.
Representative fit curves based on average coefficients and angles for (A) the composites with one fiber set aligned with respect to the stretch axes (i.e. composites 1 and 4), and (B) the composites oriented in a way closest to what the CorCap actually looks like when it is implanted (i.e. composites 5 and 6).

