
Figure 2.
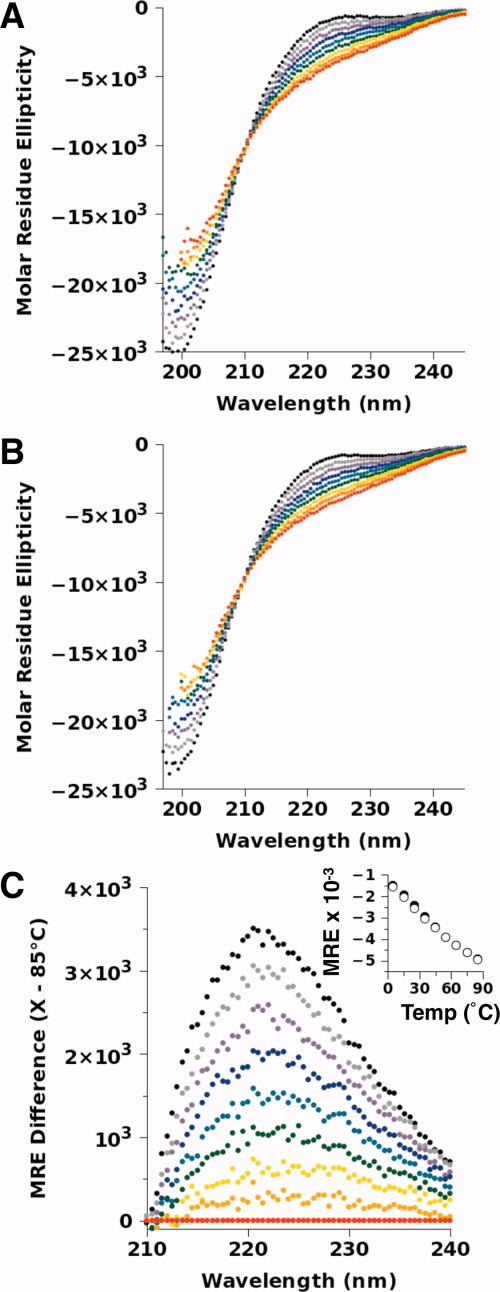
Temperature-dependent CD spectrum of p53(1–93). The spectra for (A) p53(1–93) and (B) p53(1–93) with an N-terminal histidine tag were measured in 10 mM sodium phosphate, 100 mM sodium chloride, pH 7, at the temperatures of 5°C (black), 15°C (gray), 25°C (purple), 35°C (blue), 45°C (blue–green), 55°C (green), 65°C (yellow), 75°C (orange), and 85°C (red). The CD values are reported in molar residue ellipticity using the units of deg cm2 dmol−1 res−1. The concentration of p53(1–93) in each sample was 20 μM (∼ 0.2 mg/mL). (C) The difference in the molar residue ellipticity (MRE) between the p53(1–93) spectra at each temperature relative to the 85°C spectrum, demonstrating that a local maximum occurs at ∼ 221 nm. The temperature dependence of this local maximum, determined by averaging the measured MRE values from 220–222 nm in (A) and (B), is given in the inset for p53(1–93) (open circles) and histidine-tagged p53(1–93) (filled circles).