
Figure 3.
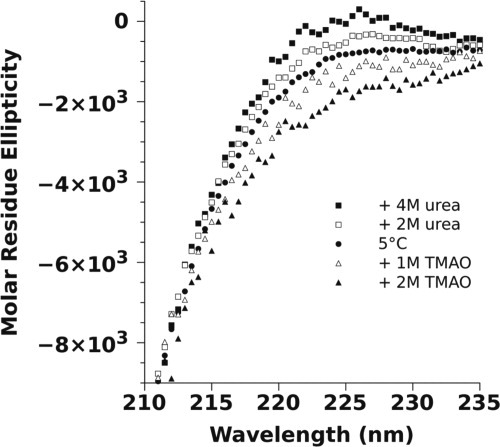
The effect of urea and TMAO on the CD spectrum of p53(1–93). The spectra for p53(1–93) were measured at 5°C in 10 mM sodium phosphate, 100 mM sodium chloride, pH 7, plus urea or TMAO as indicated in the figure. The CD values are reported in molar residue ellipticity using the units of deg cm2 dmol−1 res−1. The concentration of p53(1–93) in each sample ranged from 11 to 22 μM (∼ 0.1–0.2 mg/mL).