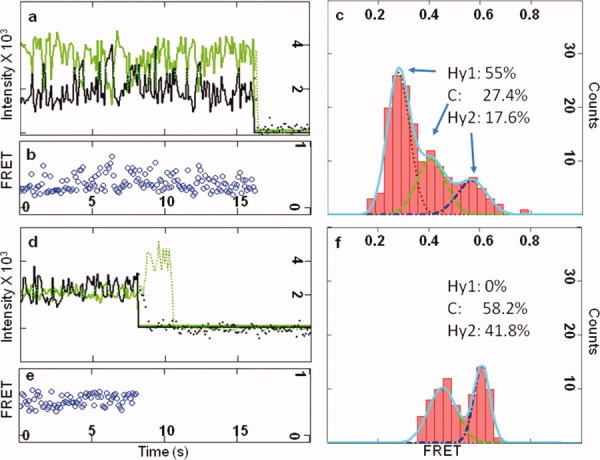
Figure 2.

Calculation of the FRET states compositions. (a) One example of a pair of donor-acceptor fluorescence intensities. The presence of a single ribosome is confirmed by single step bleaching. (b) The FRET efficiency based on (a) is calculated as efficiency = Iacceptor/(Iacceptor + Idonor). (c) Histogram analysis of the FRET efficiencies in (b). Regardless of the limited data points (on average 110 points before bleaching), the Gaussian fittings are reasonable. (d), (e), and (f) provide another single ribosome example that are similar to (a), (b), and (c). [Color figure can be viewed in the online issue, which is available at wileyonlinelibrary.com.]
