
Figure 3.
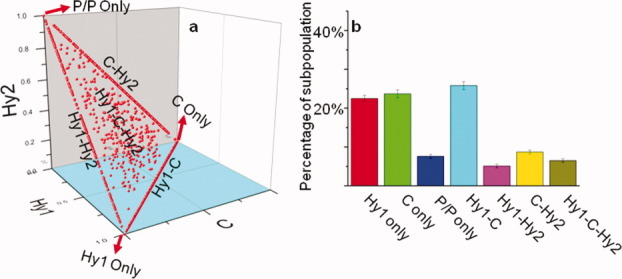
The 3D-plot and subpopulation sorting of the WT ribosome pre-translocation complexes. (a) The 3D-plot of the ribosomes according to their FRET state percentages: X, Y, and Z-axes are the percentages for the Hy1, C, and Hy2 states, respectively. Plot (a) sorts the ribosome into seven subpopulations according to the location of the data points. (b) Normalized ribosome subpopulation distributions for plot (a). The name for each subpopulation is the same as in (a). [Color figure can be viewed in the online issue, which is available at wileyonlinelibrary.com.]