
Figure 4.
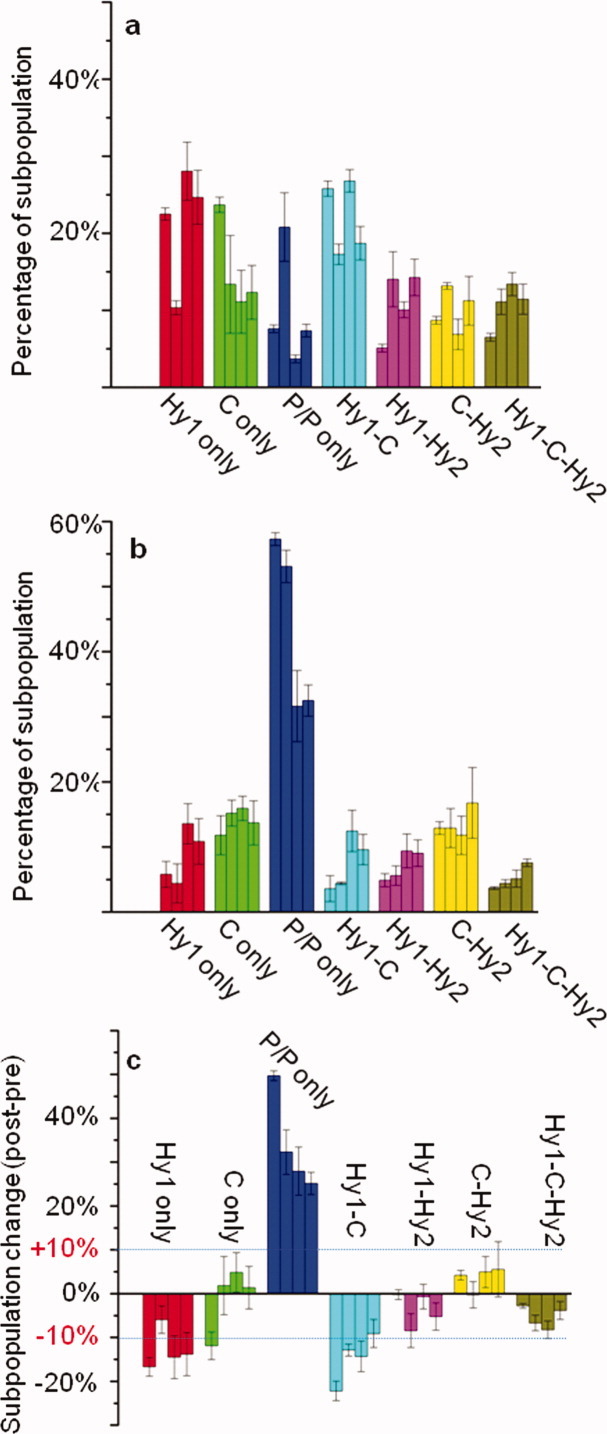
Ribosome subpopulation distributions. (a) The subpopulation distributions in the pre-translocation complexes. In each group of bars, the orders are from the Rb-WT, Rb-AH, Rb-AHK to Rb-9 aa. (b) The subpopulation distributions in the post translocation complex. (c) The subpopulation changes upon translocation (post minus pre). [Color figure can be viewed in the online issue, which is available at wileyonlinelibrary.com.]