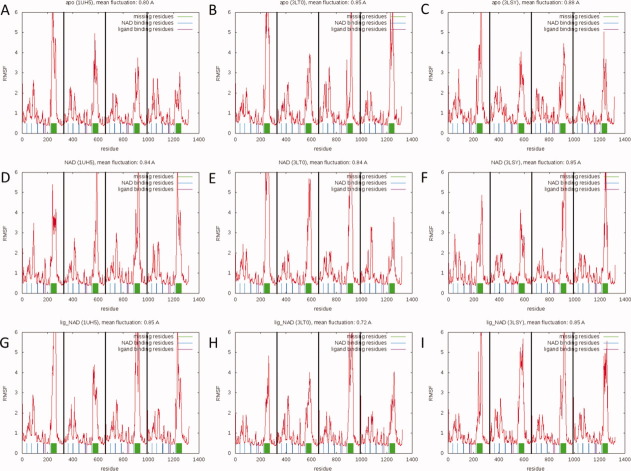
Figure 2.
RMSF versus residue plots for all nine simulations. (A) 1UH5 apo simulation, (B) 3LT0 apo simulation, (C) 3LSY apo simulation, (D) 1UH5 NAD-bound simulation, (E) 3LT0 NAD-bound simulation, (F) 3LSY NAD-bound simulation, (G) 1UH5 TCL-NAD-bound simulation, (H) 3LT0 FT1-NAD-bound simulation, and (I) 3LSY FT0-NAD-bound simulation. Largest fluctuations are observed in the central part of the substrate-binding loop. [Color figure can be viewed in the online issue, which is available at wileyonlinelibrary.com.]

