
Figure 1.
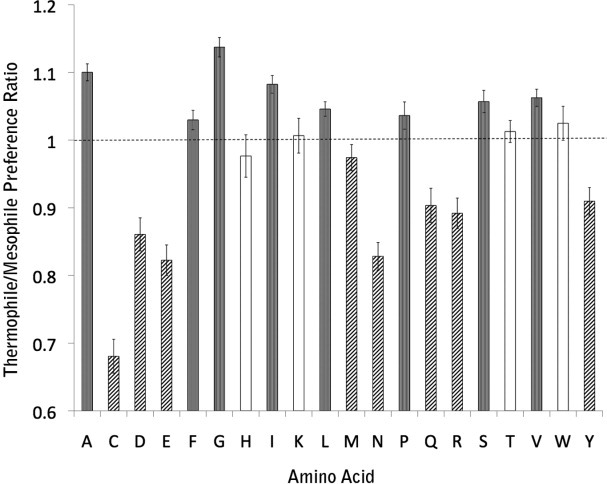
Transmembrane residues composition differences between thermophiles and mesophiles. The “Thermophile/Mesophile Preference Ratio” axis describes the ratio of fraction of each amino acid type in thermophile relative to mesophiles. Gray bars indicate significant differences >1, hatched bars indicate significant differences <1, and the white bars indicate no significant difference.