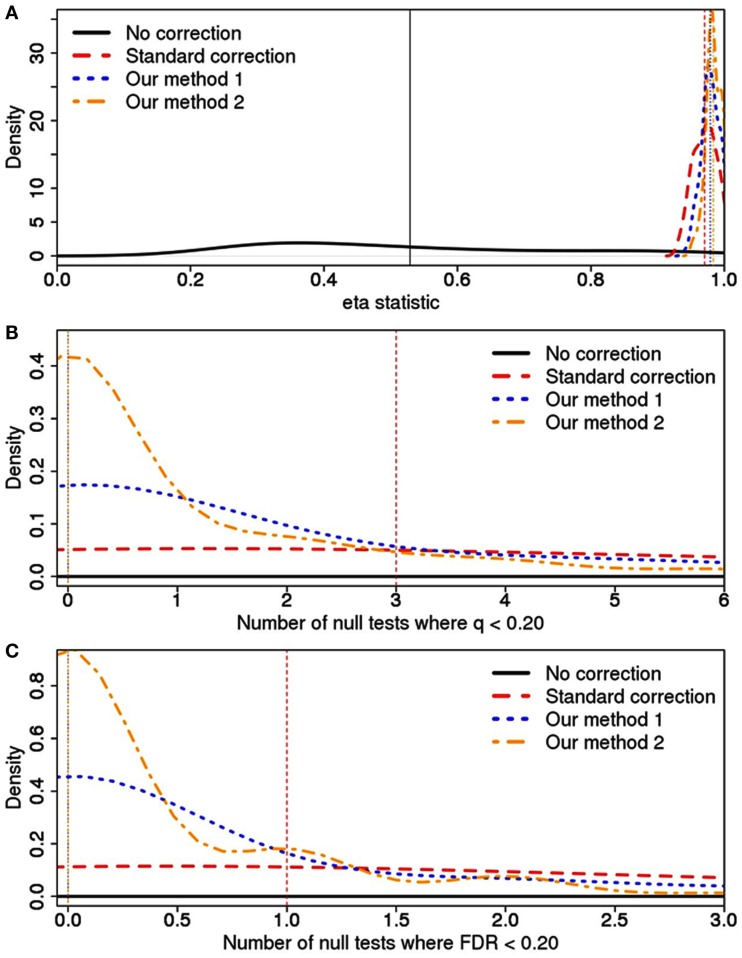
Figure 4.
Type I error rates and calculated using (A) the η statistic, (B) q-value, and (C) FDR value across various correction strategies. For each correction type, a vertical line has been drawn at the median value, although this is off the scale for the “No correction” approach in plots (B,C). Additionally, “Our methods” 1 and 2 have the same median value in plots (B,C). In (A), the scale on the x-axis is designed to demonstrate how the various correction methods all vastly outperform the model without any correction. In (B,C), the x-axis scale has focused in on the three correction methods to better demonstrate the gain resulting from our approach.

