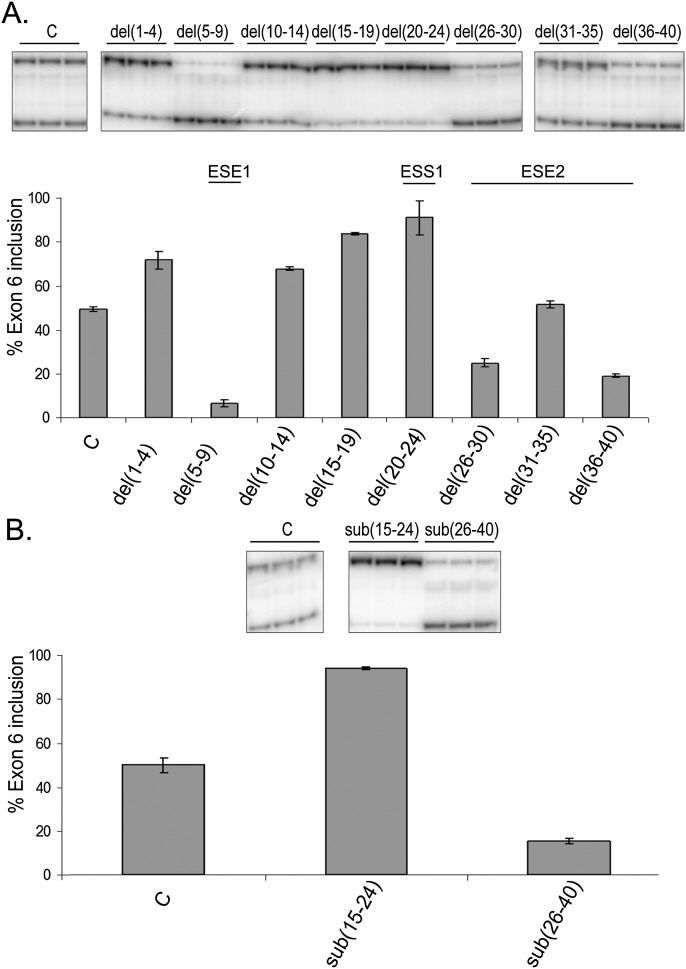
FIGURE 3.
Deletion and substitution analysis confirms the presence of ESS1 and ESE2. Deletion and substitution mutants were transfected into DT cells, and exon 6 inclusion was analyzed by semiquantitative RT-PCR as described in Figure 2. (A) Inclusion of the IL7R exon 6 in the context of the deletion mutants. Only the area surrounding the MS-associated SNP (first 40 nt of exon 6) was analyzed. (B) Analysis of substitutions to the regions encompassing regulatory elements ESS1 (nt 15–24) and ESE2 (nt 26–40).

