Fig. 1.

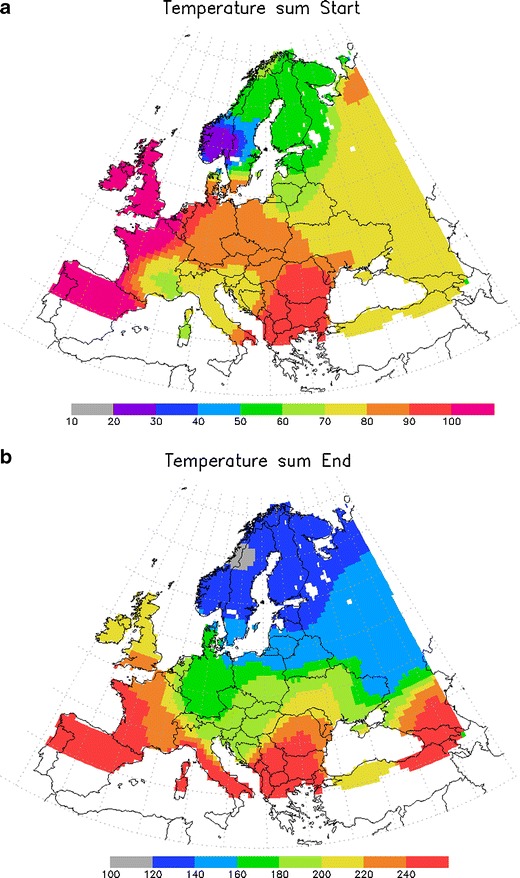
Map of the temperature sum threshold for the start of the season H fs (a) and end of the season H fe (b). Unit = [degree day]

Map of the temperature sum threshold for the start of the season H fs (a) and end of the season H fe (b). Unit = [degree day]