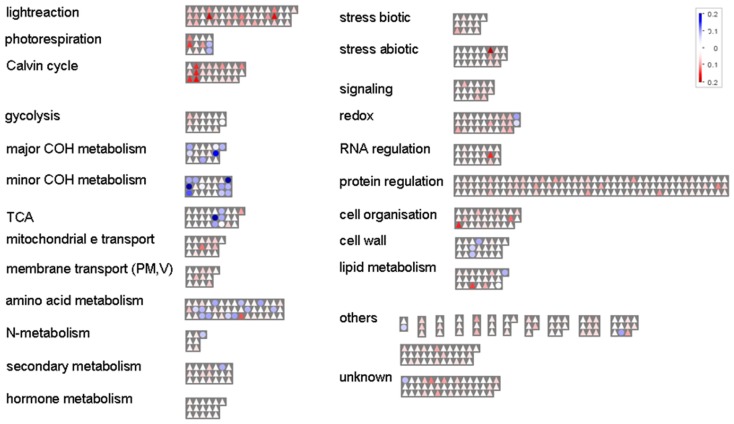
Figure 1.
Mapman overview. Functional distribution and relative abundance of the 643 shoot proteins (Log10 of the spectral count normalized by protein weight; FDR ≤ 0.01%) and 45 metabolites (Log10 of peak area normalized by DW and IS) identified. Triangles = proteins; circles = metabolites. The strength of the color indicates the abundance of the compounds.

