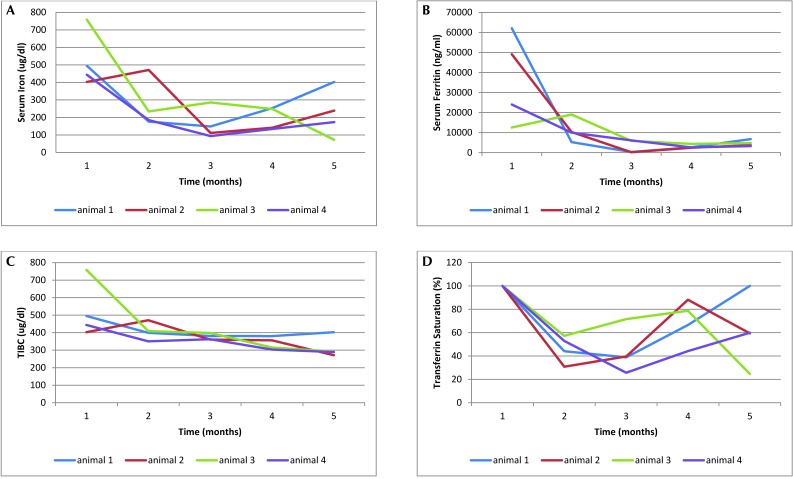
Figure 1.
Changes in (A) iron, (B) ferritin, (C) total iron-binding capacity, and (D) % transferring saturation in 4 dolphins undergoing phlebotomy treatment. Time 1, prephlebotomy; time 2, halfway through treatment; time 3, end of treatment phase; time 4, 6 mo after treatment; time 5, 1 y after treatment.

