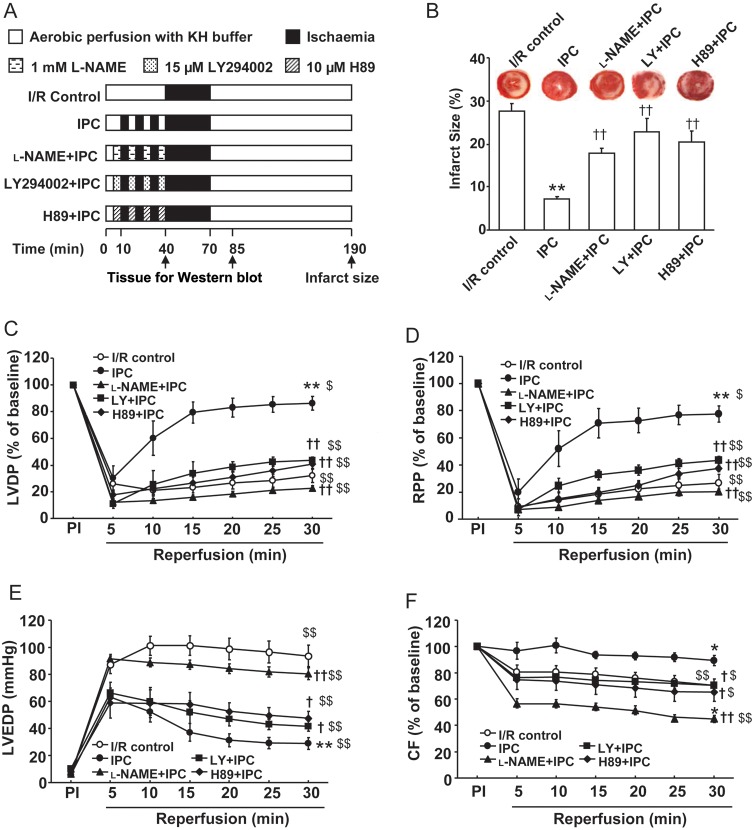
Figure 1.
Pharmacological characterization of the role of NOS, Akt, and PKA in early IPC. (A) Experimental protocols for I/R and IPC with or without treatment. (B) The infarct size expressed as a percentage of the risk area measured by TTC staining following 30 min of global ischaemia and 120 min of reperfusion for I/R control and IPC protocols in the absence or presence of l-NAME, LY and H89 as depicted in (A). (C–F) Post-ischaemic myocardial recovery following 30-min global ischaemia and 30-min reperfusion for I/R control and IPC protocols with or without l-NAME, LY, and H89 as depicted in (A). Left ventricular developed pressure (LVDP, C), rate-pressure product (RPP, D), and coronary flow (F) are expressed as a percentage of the pre-ischaemic (PI) value (100%); and LV end diastolic pressure (LVEDP, E) is expressed as mmHg. Values are means ± SE. n = 5–7/group. **P < 0.01 vs. I/R control, †P < 0.05, ††P < 0.01 vs. IPC group; $P < 0.05, $$P < 0.01 vs. pre-ischaemic (PI) baseline.

