Figure 2.
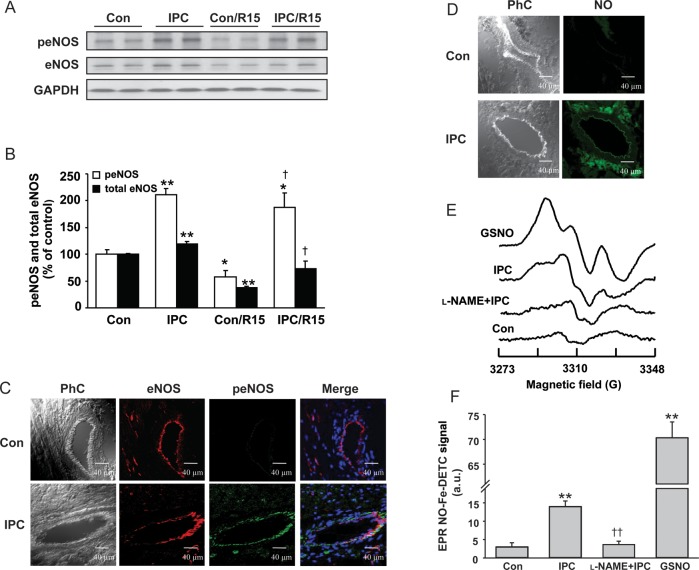
Activation of eNOS-NO signalling with IPC stimuli. Representative immunoblots (A) and quantification of peNOSSer1176 (peNOS) and total eNOS in hearts (B) subjected to control perfusion (Con), IPC, Con/R15min (30 min ischaemia, 15 min reperfusion) and IPC/R15min (IPC followed by 30 min ischaemia and 15 min reperfusion). Quantitative analyses are expressed as a percentage of control hearts in bar graphs. (C) First column phase contrast images (PhC), second column immunostaining of eNOS (red fluorescence), and third column peNOS (green fluorescence) in hearts subjected to control perfusion and IPC treatment. The fourth column shows the merged peNOS/eNOS image along with 4′,6-diamidino-2-phenylindole (DAPI) staining of the nucleus (blue colour). (D) Fluorescence images of NO (second column, green colour) detected by CuFL (1.0 µM) in heart tissue sections subjected to control perfusion and IPC treatment. (E) EPR spin trapping of NO in hearts using Fe2+-DETC. The signal of the NO-Fe2+-DETC complex was measured from frozen hearts at 77 K. GSNO: In a positive control with GSNO (20 µM) perfusion for 5 min a strong NO-derived triplet signal is seen. IPC: following the IPC trigger phase a smaller but clear NO signal is seen. l-NAME + IPC: in an IPC heart pretreated with l-NAME (1 mM) for 20 min, only trace NO signal is seen. Con: in a normally perfused control heart, little if any detectable NO signal is seen. (F) Mean NO-Fe2+-DETC EPR signal intensities from a series of hearts as described in (E). Values in (A)–(F) are means ± SE. n = 4/group. *P < 0.05, **P < 0.01 vs. control hearts; †P < 0.05 vs. con/R15, ††P < 0.01 vs. IPC group.

