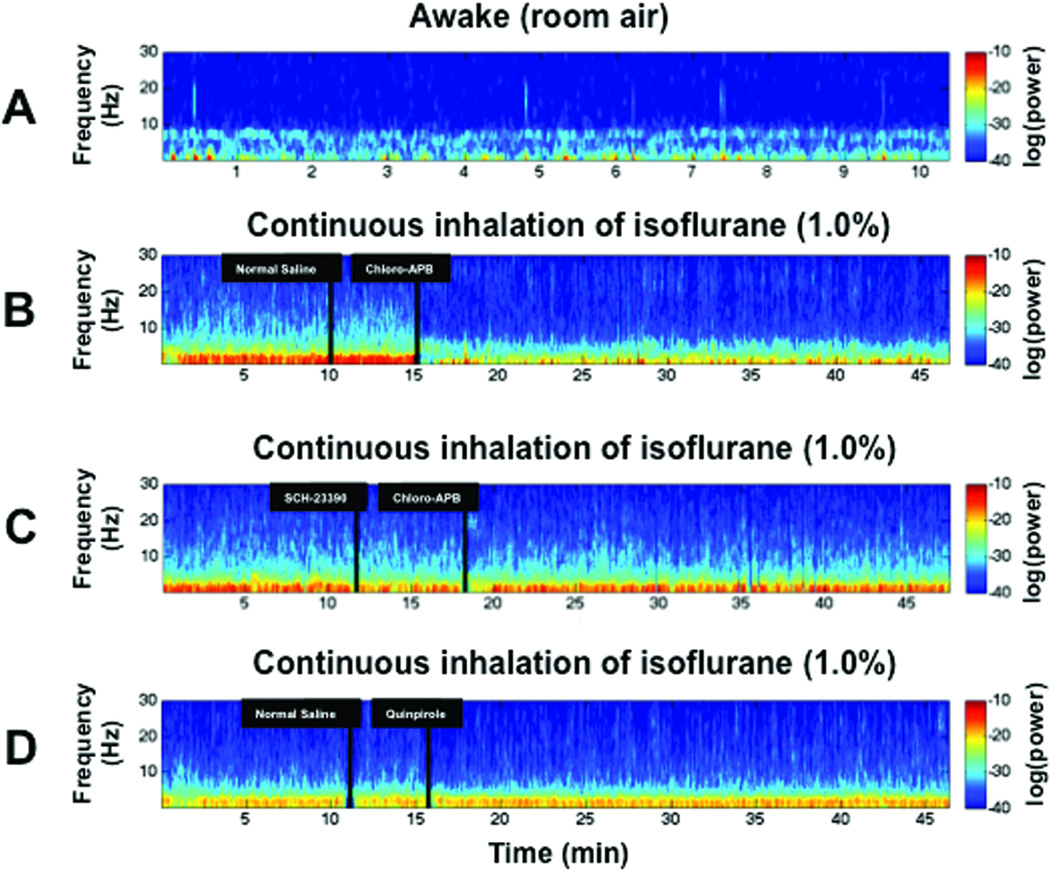
Fig. 3.
Spectral analysis of electroencephalogram data reveals a decrease in δ power induced by chloro-APB that is inhibited by SCH-23390. Warm colors (e.g., red) represent higher power at a given frequency, while cool colors (e.g., blue) represent lower power. (A) A representative spectrogram computed from a rat in the awake state shows predominance of θ power (4–8 Hz). (B) A representative spectrogram computed from a rat inhaling isoflurane (1.0%) shows predominance of δ power (<4 Hz) before and after administration of normal saline. However, administration of chloro-APB (3 mg/kg IV) promptly induced a decrease in δ power. (C) A representative spectrogram computed from a rat that received the D1 receptor antagonist SCH-23390 (0.2 mg/kg IV) instead of normal saline shows that similar to the rat in (B), δ power is dominant during inhalation of isoflurane (1.0%), before and after administration of SCH-23390. However, after the administration of SCH-23390, chloro-APB (3 mg/kg IV) failed to induce a decrease in δ power. (D) A representative spectrogram computed from a rat that received normal saline followed by the D2 receptor agonist quinpirole (5 mg/kg IV) shows that quinpirole did not induce a decrease in δ power.

