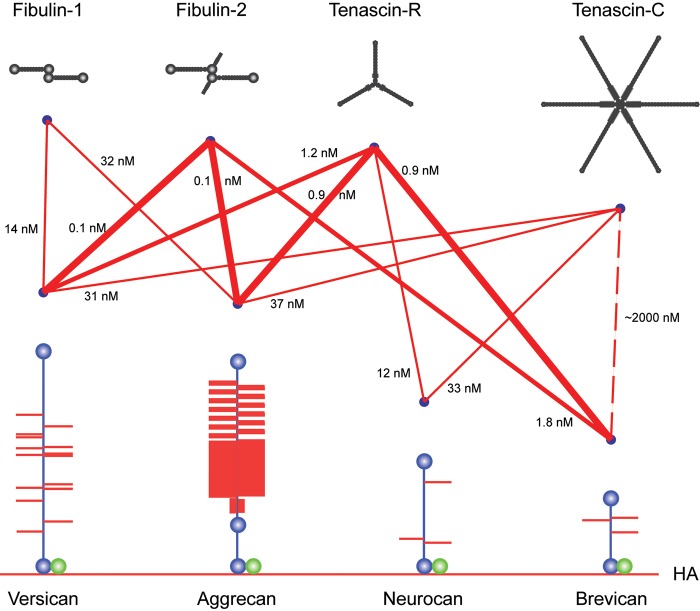
Figure 2.
Schematic of lectican C-type lectin domain (CLD) interactions with tenascin and fibulin ligand proteins. The different interactions between lectican CLDs, tenascins, and fibulins are shown as lines. Line thicknesses indicate relative binding strengths, and affinities (KD) are indicated. The lectican proteoglycans (blue core proteins with red glycosaminoglycan chains) are shown attached to hyaluronan (HA, red line at the bottom of the figure) through their respective G1 domains in complex with Link protein (green). The G3 domain CLD ligands are shown in black at the top of the figure.

