
Figure 2. The gene expression profile of HPV16 in W12 cervical epithelial cells.
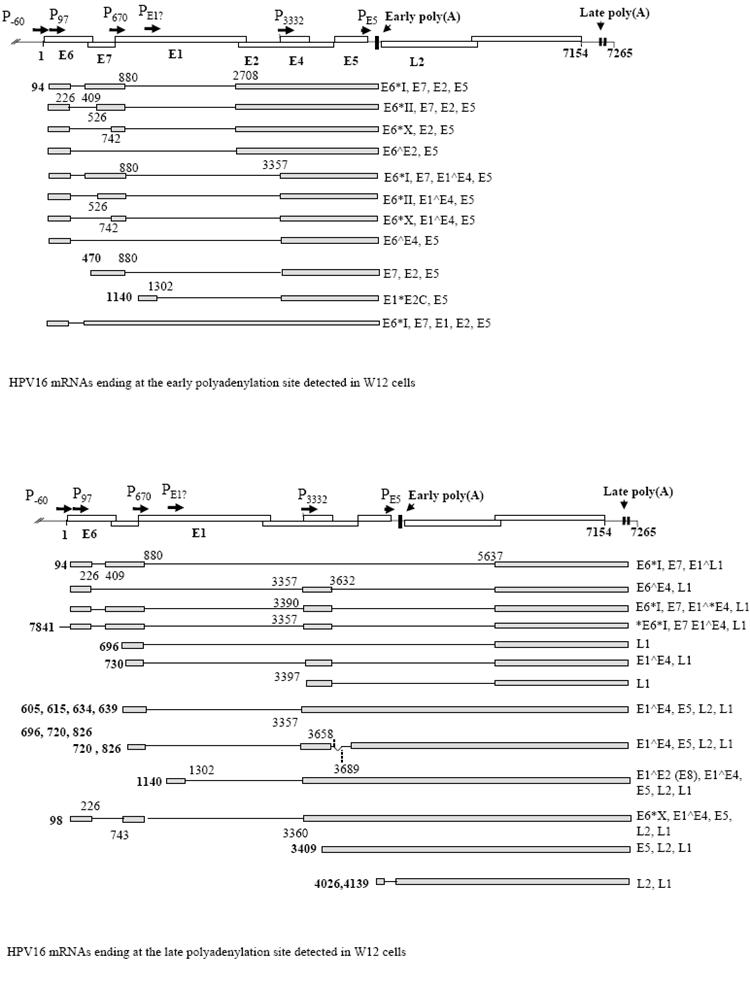
A. At the top is shown a diagram of the HPV16 genome linearised at the first nucleotide. Open boxes, open reading frames with proteins encoded indicated with bold text. Promoters are indicated with arrows and “P”. The early and the two late polyadenylation sites are indicated with arrowheads and vertical bars on the genome map. At the bottom is a diagram of the W12 early mRNAs discovered to date [48], (Milligan and Graham, unpublished data). Grey boxes, exons; black lines, introns. Numbers in bold indicate transcription start sites. The remaining numbers locate splice donor and acceptor sites. The coding potential of each mRNA is indicated to the right hand side. B. A diagram of the late mRNAs detected in W12 cells [45] with similar annotation as in part (A).