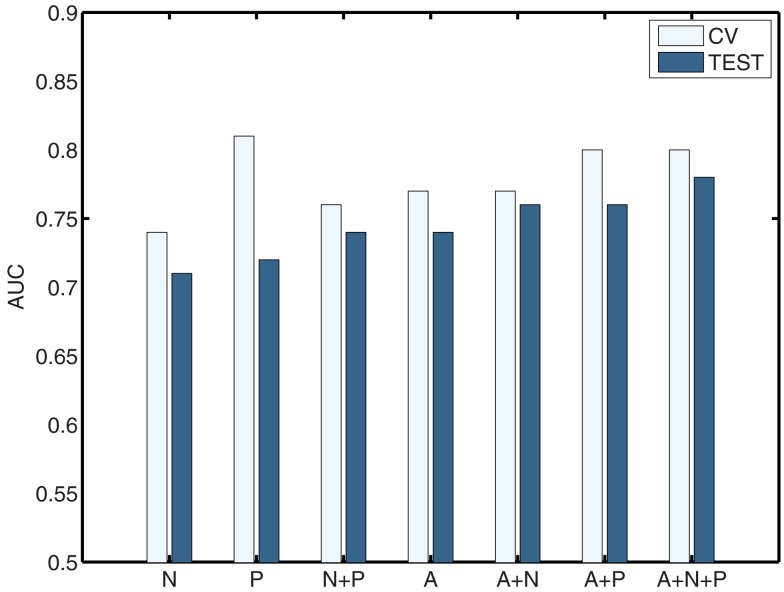
Figure 3.
Summary of best-performing classifiers using all features in the set or combination of sets below, sorted by performance on the test set (dark bars). Light bars indicate performance on non-training folds during cross-validation. A, Anatomical features; P, Non-imaging Phenotype features; and N, Network features.

