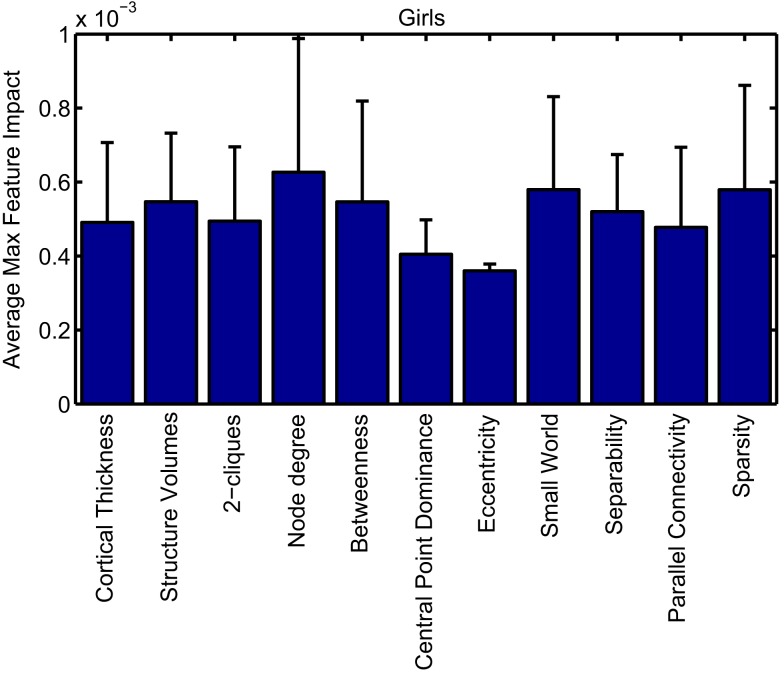
Figure A4.
Imaging feature impacts by category for girls. Bar heights represent the average (across features) of the higher value (ADHD-class or TDC-class) feature impact weight for each feature of a certain category for the female-specific classifier (using all features). Error bars are SD of those values across the features in the category.

