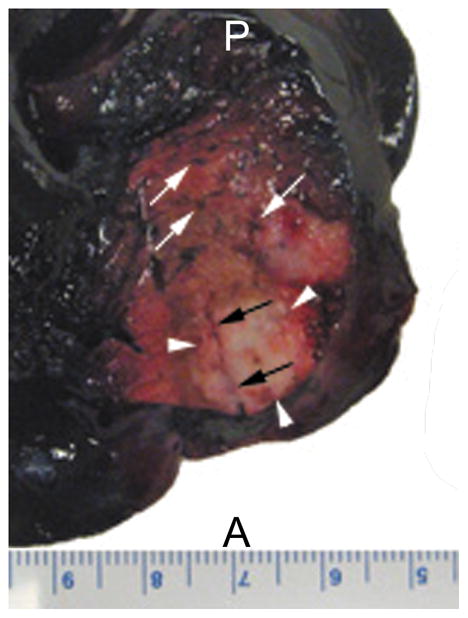
Figure 3.

Dorsal view of the left lobe of a liver specimen with VX2 tumors from a rabbit that received IV Evans blue dye after RF ablation. Dark blue color of the liver parenchyma indicates regions of intact perfusion. Red and brown colored zones surrounding the ablated tumor (arrowheads) indicate regions of disrupted perfusion. Some microvessels (white arrows) remained patent. Part of the RF probe tract (black arrows) can be visualized here as well. A, anterior; P, posterior.
