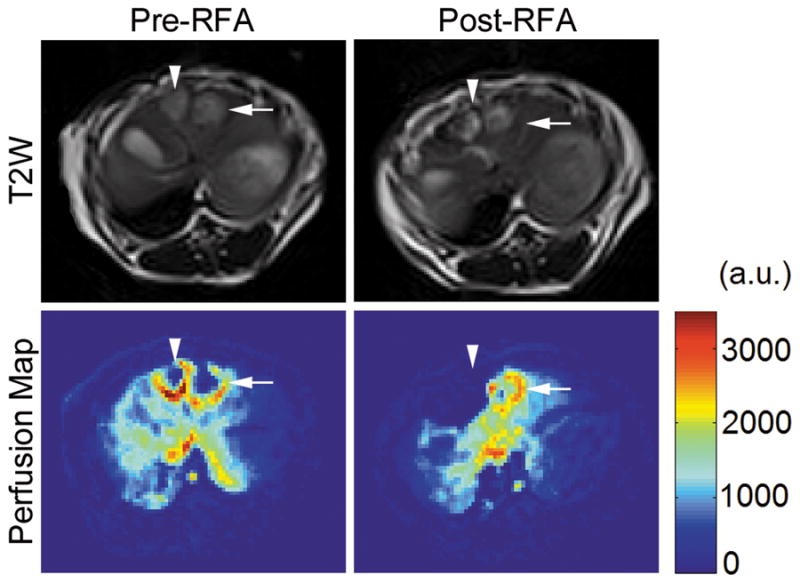
Figure 4.

T2-weighted anatomic MR images and their corresponding colored perfusion maps from a single rabbit before and after RF ablation. The arrowheads designate the tumor receiving a true ablation, whereas the arrows designate the tumor receiving a sham ablation. On the colored perfusion maps, red indicates areas of relatively high perfusion, and blue indicates areas of relatively low perfusion. Note the clear absence of perfusion in the treated tumor post-RF ablation.
