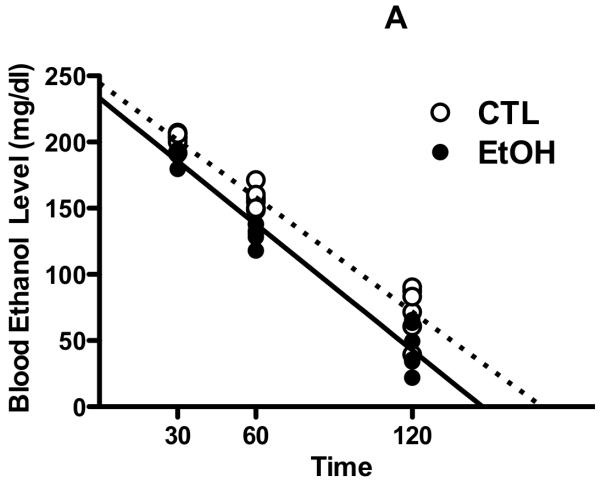
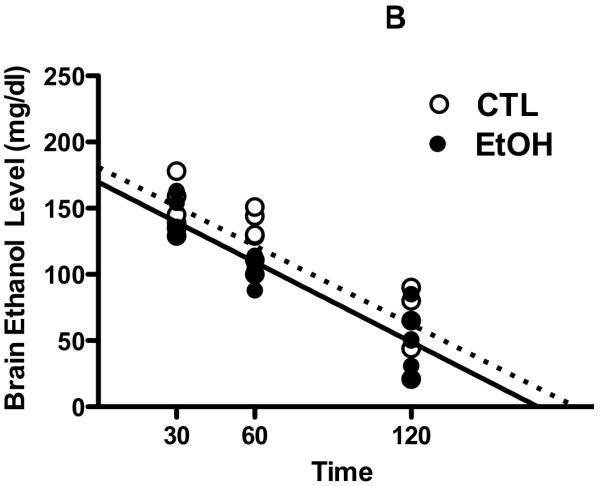
Figure 3. Ethanol pharmacokinetics following CIE exposure.
Blood ethanol concentrations (mg/dl) (A) and brain ethanol concentrations (mg/dl) (B) registered in individual EtOH and CTL subjects at 30, 60 and 120 minutes after administration (IP) of a 2 g/kg ethanol dose. Lines represent the slope obtained from linear regression analysis of ethanol concentrations (dotted line = CTL, solid line = EtOH).


