
FIGURE 4.
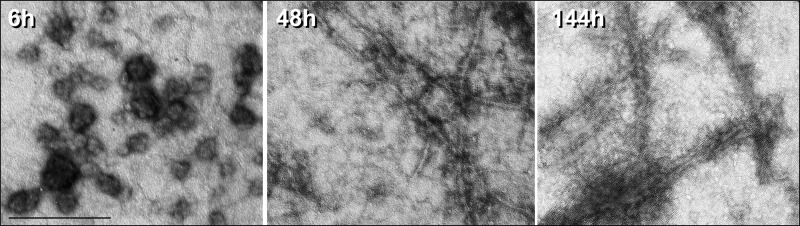
Visualization of Tau aggregation intermediates by electron microscopy. For qualitative analysis, Tau aggregation samples were applied to carbon-coated gold grids, stained with 2% uranyl acetate, and analyzed using a LEO 912 OMEGA transmission electron microscope. After 6 h of aggregation (left), spherical oligomeric aggregates predominate, which after longer aggregation time progressively convert to fibrillar aggregates (48 and 144 h) (middle and right). Magnification was ×50,000; scale bar, 242 nm.