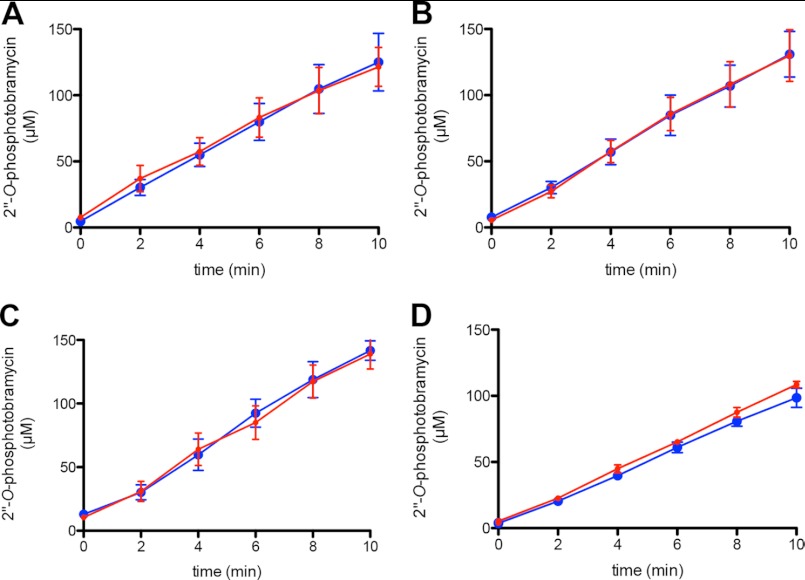
FIGURE 4.
GTP-dependent phosphorylation of tobramycin by AAC(6′)-Ie/APH(2″)-Ia in the absence and presence of various concentrations of ATP. The relative concentrations of each nucleotide were 1.2 mm GTP and 3.6 mm ATP (24) (A), 1.8 mm GTP and 3.6 mm ATP (21) (B), 5 mm GTP and 10 mm ATP (22) (C), and 500 μm GTP and 10 mm ATP (D) (adapted from Refs. 22 and 23). In each panel are time courses for the formation of 2″-O-phosphotobramycin in the absence (blue circle) and presence (red circle) of ATP. Error bars in all panels indicate S.E.

