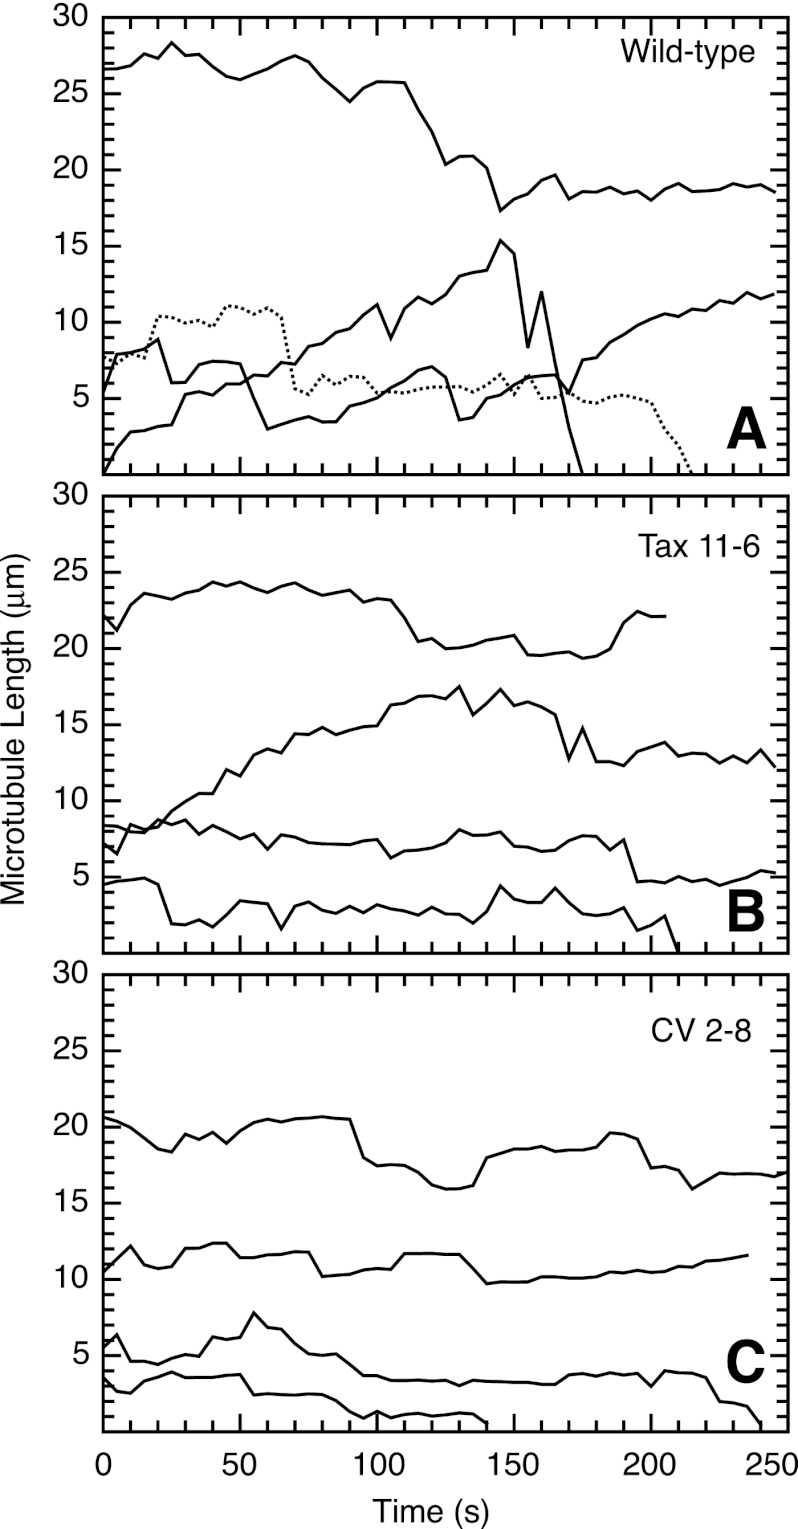
FIGURE 2.
Microtubule life history plots of wild-type and mutant CHO cells. Wild-type CHO (A), mutant Tax 11–6 (B), and mutant CV 2–8 (C) cells were transfected with EGFP-MAP4 to label the microtubules, and the cells were photographed every 5 s to observe microtubule growth and shortening events. The contour distance from a microtubule end to an arbitrary fixed internal reference point was plotted versus the time of observation. Note that each line represents a single microtubule, and the starting position of the line along the y axis is arbitrary. Plots such as these were used to calculate microtubule growth and shrinkage rates, pauses (periods of no growth or shrinkage), transitions from growth or pause to shrinkage (catastrophes), transitions from shrinkage to growth or pause (rescues), and dynamicity (total of growth and shrinkage distances per unit time). These parameters are summarized in supplemental Table S1.

